Showing posts with label WinDbg. Show all posts

Friday, 12 September 2014

WinDbg Commands and Extensions - SwishDbgExt Library

The SwishDbgExt library contains a number of interesting extensions which are imperative for deep debugging results. The SwishDbgExt library was written by Matt Suiche.

Note: If you wish to use the ProcDumpExt DLL for WinDbg, and also view the help information for the extensions provided in SwishDbgExt, then you'll need to unload ProcDumpExt first since ProcDumpExt will overload the !help extension with it's own version. You can simply load ProcDumpExt again afterwards. Alternatively, if you do not wish to unload the ProcDumpExt DLL, then simply use the longhand method of !SwishDbgExt.help <SwishDbgExt Extension>.

You must also omit the exclamation mark (!) from the extension name, otherwise the !help extension will not work.

Note: You can use the .chain command to check if you have the ProcDumpExt DLL loaded or not. The .chain command will dump all loaded DLLs for the dump file.

The available extensions from the DLL can be found by using the !SwishDbgExt.help extension without any extensions added.


I will provide a quick overview for the extensions which can be used with SwishDbgExt.

!ms_drivers:

The !ms_drivers extension is basically the same as the lm or lmnst command. There are some additional parameters you can add to the !ms_drivers extension to spice up the command. 


The !ms_drivers /scan extension can be used to find drivers using IRP Hooking.

IRP Hooking involves a hook within the array stored within the DRIVER_OBJECT structure, this array or table of IRP_MJ_ functions is hooked and the code responsible for the IRP is redirected to malicious code. Please note hooking is used for legitimate processes such as debugging and patch releases.

!ms_gdt

The !ms_gdt extension can be used to view the GDT and LDT within the GDT. The GDT is public for all processes, whereas, the LDT is designed to be private for a specific process.


!ms_ssdt

The !ms_ssdt extension will dump the SSDT and if any functions have been patched or hooked. Remember that hooking the SSDT is used by legitimate programs, and most modern rootkits tend to do not use this method anymore.


!ms_idt

The !ms_idt extension is the same as the traditional !idt extension but with the added feature of detecting hooks within the dump file.


!ms_timers


I wouldn't consider the !ms_timers as a replacement for !timer, however, it is a great extension for being used to conjunction with the WinDbg !timer extension. The !ms_timers can detect hooking within the _KTIMER_TABLE.


Saturday, 9 August 2014

Windows Access Tokens - !token and _TOKEN

Windows needs to ensure that untrusted code and untrusted users aren't accessing important areas of the operating system, and creating problems which would ultimately lead to a vast number of BSODs.

Windows manages this through Access Tokens which are used to identify the security context of a process/thread and a user. Access Tokens take two main forms: a Primary access token and a Impersonation access token. The Access Token additionally has two important features which are integral to security validation: SIDs (Security Identifiers) and a Privilege Array which contains the privileges allowed for that object.

The token type can be found within a enumeration called TOKEN_TYPE. 

 The data structure can be found under the TokenType field within the _TOKEN structure. The Primary type determines the security context of the process for the currently logged on user, and the Impersonation type allows a thread to temporarily use a different security context.

The Token type can also be found using the !token extension:

We can view the Privilege Array within WinDbg, by using the !token extension with the address of the access token for a given process, the Privilege Array can be seen below:

As mentioned before, the SID is used to determine if a thread or process has access to an object, and the privilege array will determine what that process or thread is able to do with that object. For example, being able to read and write to a file object.

SIDs have a unique format, and each segment will provide some useful identity information. Each SID will be stored with a _SID data structure as shown below:

 These fields can be found within a SID, for which I will demonstrate in a moment. Each SID will have a S prefix. If you know the address of a SID, then you can use the !sid extension to translate the address into the appropriate SID.


The three numbers in yellow, and in preceding in chronological order, represent the use of the SID, the revision number and identifier authority. The blue represents the sub-authorities and the green represents the RID or relative identifier.

The SID use can be found within an enumeration called SID_NAME_USE. The 1 indicates that this is a User SID.


The sub-authorities belong to the identifier authority, and used for more unique identification. The identifier authority or issuing authority tends to be Windows.

The relative identifier is used to identify the SID in relation to the issuing authority. Each unique user or group will start at 1000, and for each new user or group, then this number be incremented by 1, therefore there is at least two users on this system. Administrators are typically given 500 and Guest accounts are given 501.

Primary and Impersonation Tokens have two subtypes: Restricted Tokens and Filtered Admin Token. A Restricted Token is derived from another access token with the following limitations:
  • Privileges can be removed from the privilege array.
  • The SIDs in the token can have their access altered.
 There is also a Filtered Admin Token which alters access rights, sets the integrity level to medium and most of the privileges are removed from the privilege array. 

I will conclude this article by describing some of the more interesting and helpful fields within the _TOKEN data structure.


TokenSource - The _TOKEN_SOURCE structure provides a information pretaining to the soruce of the access token. This can be the RPC server, Session Manager or LAN Manager.

TokenID, ParentTokenID and AuthenticationId - The Locally Unique Identifier (_LUID) is used to uniquely identify a access token from the many other potiental access tokens being used on the system. See the _TOKEN_CONTROL data structure for more information.


Privileges - The _SEP_TOKEN_PRIVILEGES structure contains the array of privileges related to the access token.

TokenType - The _TOKEN_TYPE shows if the access token is a primary or impersonation token.

ImpersonationLevel -  The _SECURITY_IMPERSONATION_LEVEL is an enumeration of impersonation levels for the impersonation token. There is four different impersonation levels.


TokenFlags - This field contains any flags which have been set for the access token.

TokenInUse - Shows if the access token is currently being used.

SidHash, RestrictedSidHash - These two hashes for the SID have been added to prevent token stealing. These hashes are checked each time the token is used.

References:

SID Components (Windows)
Access Tokens (Windows)
Restricted Tokens (Windows)
Impersonation Levels (Windows)


Saturday, 12 July 2014

WinDbg Power Policy Extensions - !podev, !popolicy, !poreqlist, !pocaps, !poaction

The !podev, !poreqlist and !poaction aren't documented within WinDbg for some reason, but there is a person which has written about them thankfully. These extensions are a must for Stop 0x0A and debugging any issues related to power like Stop 0x9F.

!popolicy 

The !popolicy displays information related to the current power policy of the current user. 


!pocaps

The !pocaps extensions displays information in relation to the power capabilities of the system, this is ideal for checking if drivers are attempting to use a unsupported sleep state.

!poreqlist

The !poreqlist extension will list all outstanding power IRPs from any driver which has called the PoRequestPowerIrp function. The function will create a Power IRP and then send it to the top of the device stack for a given device object.

 The list of power IRPs will be shown under the FieldOffset field. The extension will provide the device object, driver object and the nature of the power IRP.

!poaction 

The !poaction extension will provide the current power action, and a list of devices which are currently being powered off or down. It also provides a list of completed IRPs. !poaction may require a Live Debugging session, but I'm not sure on this due to the lack of documentation.


!podev

The !podev will provide power related information for a PnP device object.


References:

Debugger commands (!drvobj, !devobj, !podev, !devstack) that make my life easier (part 1)
 
Debugger Commands (!poaction, !poreqlist) that make my life easier (part 2)

Thursday, 3 July 2014

WinDbg Extensions - !tz and !tzinfo

When I was writing up my WinDbg cheat sheet, I managed to stumble upon the !tz and !tzinfo extensions in the WinDbg Help documentation. The extensions seem to be solemnly documented directly by Microsoft, but using the ACPI documentation is easily to understand what most of the fields mean.

The !tz and !tzinfo gather information from the ACPI subsystem about the currently allocated thermal zones and the cooling policies being implemented. On Windows, you can manipulate the cooling policies slightly by changing your Power Settings.

Power Settings - Windows 7
 
By changing the power consumption, the Active and Passive Cooling policies will be changed. I will explain the difference between Active and Passive cooling later.

The Thermal Management mostly uses a component called the OSPM (Operating System Directed Configuration and Power Management) to manage different cooling policies and check the thermal zones.

The OSPM is used to remove any device management responsibilities from the legacy devices, and therefore made thermal management more robust.

The OSPM creates logical regions called Thermal Zones. Thermal Zones are a key component within Thermal Management. The entire motherboard is one thermal zone, and is usually subdivided further into smaller thermal zones to make management more efficient. A cooling policy is set for each individual device with a thermal zone, and therefore each thermal zone will have multiple cooling policies and cooling resources (e.g. fans). An example of a thermal zone is below:


We can find the Thermal Zones on a system using the !tz extension in WinDbg.

The most useful part of the !tz output is the Thermal Info Address which we can use with the !tzinfo extension to give the trip point temperatures of the thermal zone(s).

These trip point temperatures correspond to the cooling policies implemented when that threshold is reached. Each device within a thermal zone will have its own threshold. The two main cooling modes are Active Cooling and Passive Cooling.

Passive Cooling - The operating system will decrease the power consumption of all devices, in order to reduce the temperature of the system, however, the cost is a reduction in system performance.

Active Cooling - The operating system will increase the power consumption of cooling resources such as fans, to decrease the temperature of the system. Active Cooling has better system performance, but with laptops it will reduce the battery life much faster than usual.

There is also a Critical temperature threshold, whereby if any thermal zone breaches this threshold, then the entire system will shut down. The thresholds are managed by objects called Thermal Objects. 

The _TMP object is the current temperature of a thermal zone, and is compared to the _HOT, _CRT, PSV and _AC0/_AC1 thermal objects in order to implement the different cooling policies. The thermal object thresholds can be seen in the diagram below:


If the _TMP object value reaches the _CRT (Critical Temperature Threshold), the entire system will shut down. If the _TMP reaches the _HOT value, then the system will be placed into the S4 sleep state (Hibernation) if this mode is supported. 

If the _TMP object reaches the _AC0/_AC1 (Active Cooling) then the Active Cooling policy will be implemented; there is two versions which adjust the fan speed. If the _TMP object reaches the _PSV (Passive Cooling) then the Passive Cooling policy is used. The Thermal Events are notified to the OSPM by Thermal Change Notifications.

We can check which power states are supported by using the !pocaps extension:

The power states are stored within an enumeration called _SYSTEM_POWER_STATE.

Additional Reading:

Thermal Management 

 System Power States (Windows)


Wednesday, 2 July 2014

Using !kuser to find _KUSER_SHARED_DATA

The _KUSER_SHARED_DATA structure contains some interesting information related to the currently logged on user, we can obtain the address of this data structure by using the !kuser extension in WinDbg. Most of the fields aren't officially documented from what I can find, but you should be easily be able to work out what they mean from their names.


Using the address with the _KUSER_SHARED_DATA will provide the following (omitted structure):


There is some debugging bit fields within this structure, so you can check what debugging features have been enabled for that user. It also contains some basic system information.

Additional Reading:

The System Call Dispatcher on x86

struct KUSER_SHARED_DATA


Friday, 27 June 2014

WinDbg Cheat Sheet

I've created a comprehensive and complete WinDbg cheat sheet of the most general and useful extensions/commands which you'll be using regularly. I've added a few data structures to the list too. The list is organised by category, according to the different areas of debugging such as Memory or I/O.

Download Link (OneDrive) - https://onedrive.live.com/?cid=7101A9E8FE03DB78&id=7101A9E8FE03DB78!105
  
If there are any suggestions or corrections to be made, then please leave a comment in the comments section. Additionally, I've been attempting to convert my blog posts into a .DOC format which can be printed, unfortunately I haven't added any images to conserve space and ink. However, I have tried to construct the blog posts so you know which row or column to check; dd commands with the IAT/EAT post for example.

Wednesday, 18 June 2014

List of Reverse Engineering and Debugging Tools

I may have created a small list of tools before, however, I would like to expand this list and provide some better descriptions for each of the tools listed. These tools are either completely free or have a limited free version which provides enough functionality for those like myself, who aren't professional security researchers, escalation engineers or get paid for doing reverse engineering/debugging. These tools can and are used by professionals and enthusiasts alike. If you have any recommendations then please add a link to the comments section.

WinDbg - Reverse Engineering/Debugging

This tool is my most favorite, it provides complete functionality for enthusiasts and is for free. There is a wide range of extension and commands for viewing data structures, memory addresses and call stacks. It can be used for both reverse engineering and debugging BSODs (Blue Screens of Death).

There is good documentation for WinDbg for finding hidden rootkits, examining data structures and looking at raw memory. Most of this information has been used in my blog for writing tutorials and adding my own information to. It can be used for static analysis and real-time analysis.

Link - Windows Driver Kit (WDK) and Debugging Tools for Windows (WinDbg)

OllyDbg - Reverse Engineering (User-Mode)

OllyDbg is a great tool for reverse engineering user-mode programs. This is a another standard tool if you wish to examine malware or would like to learn the PE structure. This tool is for free, and again is there is great documentation for learning how to use it. Please check the Blogroll section for such blogs.

The data structure being viewed is the _PEB data structure, which is stored at offset 0x30 in the FS register for x86 systems. It is primarily used for static analysis.

 Link - OllyDbg v.1.10


IDA Pro - Free Version

 This tool is used for reverse engineering, and widely used by professionals to my knowledge. This is a very powerful tool, and be used to examine libraries in the IAT and EAT, look at strings stored in memory and assembly instructions. There are tutorials available on their website.


Link - IDA: About


Analyze It!

This tool is great for displaying information about a specific binary file (static analysis).


I could only find the program hosted on Softpedia, but I'm sure that there wasn't any other programs bundled with the installation package.

Link - Analyze It! Free Download (Softpedia)


PeStudio

This is tool provides the same features as the other program, but with a simpler and cleaner UI and is easier to use in my opinion. It also has VirusTotal integration.


Link - PeStudio

Twitter - @ochsenmeier (Developer + Updates)

Hook Analyzer

The program enables you to hook to a certain active process, and then pull information from that process. It only works with Ring 3 (User-Mode) processes to my knowledge.
 

PE Bear

PE Bear is another static analysis tool for examining PE files, you can view file signatures and view packers which have been used.

 Link -PE Bear Blog

WinHex 

WinHex can be used for examining the hexadecimal format of files.


Process Explorer

Process Explorer is a Microsoft produced tool, which can be used for finding general information about active processes. It has Virus Total integration.

Saturday, 26 April 2014

Process Directory Table Base and CR3 with Stop 0x101

This is a very simple error, and be can useful in providing a hint at which point the crash may have occurred. This has been explained by Scott Noone on this blog, but I wanted to write my own blog post about it and provide the data structure which he didn't mention. The error was found by Patrick in a Stop 0x101 bugcheck, and perfectly matches the context of the crash.

Looking at Parameter 4, we can see the Processor Index Number which has become hung. This is where the error message is located too. 


The highlighted address is the physical address stored within the CR3 Register. 


Using the !process extension on the same Processor Number Index, we can check the DirBase field to find the mismatch within the two address indicated in the error message. The DirBase is a physical address of the Process Directory Table Base.


The DirBase field is the field within structure formatted with !process, which contains the address of the Process Directory Table Base for the current process, and thus if the two addresses don't match, then WinDbg will produce that error string. It tends to be caused when a crash occurs during a context switch. You can find the same field under the _KPROCESS data structure:

 The Process Directory Table Base is private to each Process Address Space and is used with conjunction to the TLB Cache and TLB Flushing. It's all the virtual address pages which correspond to that process, and thus when a Context Switch occurs, then the Control Register can be changed to the address of the process and all the entries within the TLB Cache are flushed. Afterwards, when the new addresses have been loaded, each page translation will result in a complete page walk until all the TLB Cache Entries have been rebuilt. This is a expensive process, and thus some processor architectures will tag entries corresponding to certain processes, and then only flush the corresponding tags.

References: 

Process directory table base doesn't match CR3
Translation Lookside Buffer

Original Thread (Synsative) - BSOD(A clock interrupt was not recieved on a secondary processor...)


Monday, 21 April 2014

Introduction to Detecting Anti-Debugging Techniques

Malicious Software is able to detect if it's running within a debugging environment or a debugger has been attached to the process, and thus will not generate of it's malicious behaviors in order to avoid detection from the security analyst or whoever is attempting to debug the process. In this article, I'm going to describe some of the common anti-debugging techniques which are used to detect the presence of a debugger.

 NtGlobalFlag:

The NtGlobalFlag is located within the Process Environment Block (PEB) at offset 0x68 on x86 Windows, and at offset 0xBC on x64 Windows.

Windows 7 SP1 x86


The default value is always 0, and doesn't change when a debugger is attached to the process. There are several methods in which the NtGlobalFlag can be changed to detect the presence of a debugger. The NtGlobalFlag contains many flags which affect the running of a process.

The most common flags which are set with NtGlobalFlag when a debugger creates a process, is the heap checking flags:

FLG_HEAP_ENABLE_TAIL_CHECK (0x10)
FLG_HEAP_ENABLE_FREE_CHECK (0x20)
FLG_HEAP_VALIDATE_PARAMETERS (0x40)

I've spoken about the purpose of these flags in a previous blog post which can be found here. These flags can be checked to detect the presence of a debugger. The general code from CodeProject, for checking the above flags:
unsigned long NtGlobalFlags = 0;

__asm {

    mov eax, fs:[30h]
    mov eax, [eax + 68h]
    mov NtGlobalFlags, eax
}


if(NtGlobalFlags & 0x70)
// 0x70 =  FLG_HEAP_ENABLE_TAIL_CHECK |
//         FLG_HEAP_ENABLE_FREE_CHECK | 
//         FLG_HEAP_VALIDATE_PARAMETERS
{
    // Debugger is present
    MessageBox(NULL, TEXT("Please close your debugging " + 
               "application and restart the program"), 
               TEXT("Debugger Found!"), 0);
    ExitProcess(0);
}
// Normal execution
IsDebuggerPresent():

The IsDebuggerPresent() is a Kernel32 function which will return the Boolean value of True, if a debugger is attached to the process. It can be found by checking the IAT. 


It can check the BeingDebugged field of the PEB:

char IsDbgPresent = 0;
__asm {
     mov eax, fs:[30h]
     mov al, [eax + 2h]
     mov IsDbgPresent, al
}

if(IsDbgPresent)
{
    MessageBox(NULL, TEXT("Please close your debugging " + 
               "application and restart the program"), 
               TEXT("Debugger Found!"), 0);
    ExitProcess(0);
}
// Normal Execution
The CheckRemoteDebuggerPresent() is a similar function, and can be detected with the same method.

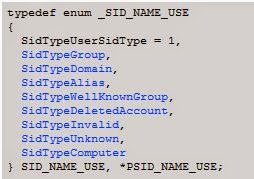
NtSetInformationThread() - Thread Hiding:

The NtSetInformationThread() function has a hidden undocumented parameter called ThreadHideFromDebugger (0x11), which can be used to prevent any debugging events being sent to the debugger. Debugging Events are events which will notify the debugger, these can be the creation of new threads; generation of an exception; loading and unloading of DLLs and creating child processes.

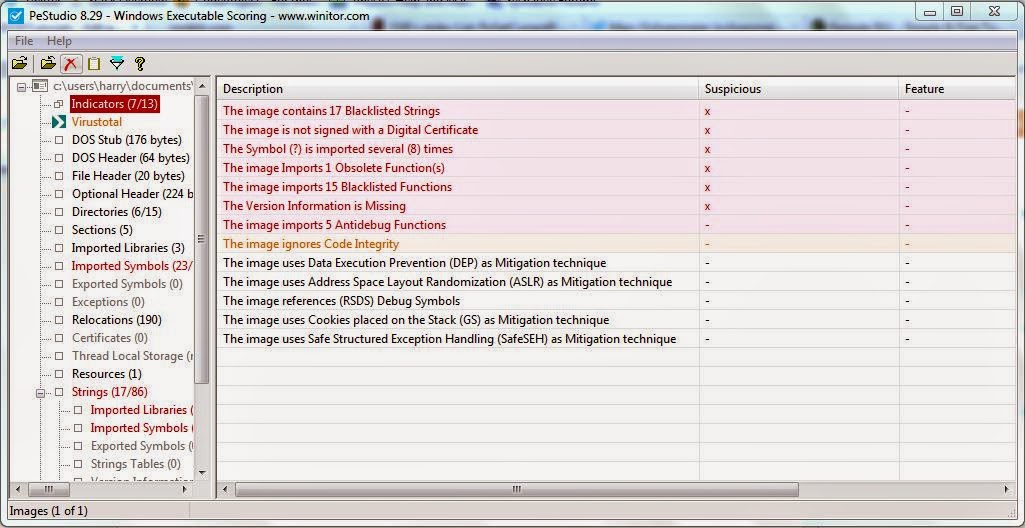
You can check if this function is imported in the IAT. PeStudio or a similar program like PeBear may check for this function.

Execution Timing:

This is a simple idea and is implies that the execution time when be slightly more with the presence of the debugger. This technique measures the execution time, and if slightly longer than usual, can imply the use of a debugger. The common instructions include:
  • RDTSC, RDPMC and RDMSR instructions.
  • GetTickCount(), GetLocalTime() and GetSystemTime() are all functions within the Kernel32 library.
Again, you can check if these functions are imported within the IAT.

Software Breakpoint Detection:

The instruction 0xCC - INT 3 is used  to stop the execution of the debugged process and then pass the control to the debugger. The instruction is saved before the implementation of the breakpoint. Any comparison instructions (CMP, CMPXCHG) which use this instruction as a operand are considered as a anti-debugging technique.

Friday, 18 April 2014

Debugging LPCs with WinDbg

LPCs or Local Inter-Process Communication calls are used to communicate between two User-Mode NT components, or between a User-Mode component and a Kernel-Mode Component. I believe there may be some bugchecks related to LPCs or at least problems you may potentially run into when working with LPCs if your a software engineer.

The User-Mode to Kernel-Mode communication tends to be related to security, and the User-Mode components tends to be related to creating logon sessions for the user. The terms Client and Server are used here, and this tends to refer to a different thread or different process. It depends on who created the port and who is receiving the messages. LPCs build upon the concept of IPC (Inter-Process Communication):

Methods of IPC:
 
The methods are usually some form of synchronization like a Semaphore, or a shared object such as a File object or Memory-Mapped File. A comprehensive list can be found on Wikipedia.

Port Creation and Port API:

With Windows Vista onwards, the LPCs have been changed to ALPCs but as far as I'm aware they still have the same structures and can still be debugged in the same way. I've taken a list of the APIs from the MSDN blog to save writing the same information:


The messages are less than 256 bytes according to Microsoft. The messages (LPC/ALPC) are sent between the client and server. Each named port has a Security Descriptor and is able to check if it wishes to accept a connection request from a client by checking the CLIENT_ID.


Once the Server has successfully created a named connection port with NtCreatePort, then a Client may wish to establish a connection with the connection port, whereby the Server may check the CLIENT_ID, and if it is accepted (NtAcceptConnectPort) then two new ports will be created. These ports are the Server Communication Port and the Client Communication Port. A handle will be created to the Server Communication Port and given to the Server, and a handle will be created for the Client Communication Port and given to the Client, these ports are used to send and receive messages. The Server Communication Port can terminate the connection.

Now let's examine the Port Object data structure which is used to represent a type of port with server process and owning process. Using the _LPCP_PORT_OBJECT which can we can view using WinDbg and a Kernel Memory Dump. This is allocated from paged pool.

The ConnectionPort is a pointer to a similar data structure which is used to represent the Server Connection Port, and the ConnectedPort is used to represent the Server Communication Port.

The ClientThread is the Client's thread, and the ServerProcess is the Server's process. The LpcReplyChainHead is a doubly linked list of all the threads which are currently waiting for a reply from a sent message to that particular communication port.

The MsgQueue contains another data structure and a few additional fields of interest:


The Sempahore is used as a signal to show that messages are waiting within the doubly linked list which is the RecieveHead field. 

The ReceiveHead as stated before is a doubly linked list containing all the messages which need to be dequeued by the server.

The NonPagedPortQueue is related to the Client Communication Port and is used to track any lost replies from the Server. The fields seem to similar to the general port queue.


The next important data structure is the _LPCP_MESSAGE structure which is allocated with paged pool, and used to track message related information between the Server and Client. This information includes Message Type, Message ID and the ClientID. We can also search through paged pool using the pool tag which is LpcM. ALPCs may use the _KALPC_MESSAGE data structure instead which contains similar information.


Here's the data structure for the message:


The SenderPort field is the Client Communication Port. It should have a Port Object data structure associated with it.

The RepliedToThread is the Client Thread which has been replied to.  The Entry field is the entry within the doubly linked list associated with the Message Queue.

The Request field is a copy of message buffer passed as a parameter with the NtRequestWaitReplyPort. The _PORT_MESSAGE data structure contains a few additional fields.


The MessageId field is a unique message identifier. The CallbackId is the the Sender ID or related to the Sender. The ClientViewSize is the size of the section created by the sender, when using Memory Mapped Files, this applies when using the NtCreateSection/CreateFileMapping and thus _PORT_VIEW data structure.

The DataLength and the TotalLength fields are associated with the length of the data within the message and the header, and the TotalLength includes the size of the _PORT_MESSAGE structure.

We can check the _EPROCESS and _ETHREAD fields for information related to LPCs.

Let's begin with the _EPROCESS data structure which contains three LPC ports, which each have their own function within the Windows operating system:

The DebugPort is used for sending debugging messages (User-Mode), the ExceptionPort is used with CsrCreateProcess and used to create a new process with a connection with the debugging port. _LPC_EXCEPTION message is sent using this port when a thread doesn't catch a exception. The SecurityPort is used by the lasass.exe process for security purposes.

Using the -y switch to set some search query parameter, we need to search the _ETHREAD data structure for some LPC fields. On Windows Vista and later systems, some of the fields seems to have been removed. Windows XP will have the original LPC fields. 

AlpcMessageId is the message sent to the Server while the Client Thread waits for a response. The AlpcMessage is a pointer to the message data structure seen earlier or I assume it to be. The AlpcWaitListEntry is a list of threads waiting for a reply from the Server communication or connection port depends upon the situation. The AlpcWaitSempahore causes a Client Thread to wait while the Server processes the message received.

The original Windows XP fields are described in the table below:
 
WinDbg Debugger Extensions:

The ALPC extensions do not seem to be documented within the WinDbg documentation, but the !lpc debugger extensions are documented. !lpc only applies to Windows XP and earlier. Windows Vista onwards will need to use the ALPC extensions which are limited in comparison. 

I'm using the !alpc version of the debugger extension, but the !lpc extension seems to have more functionality such as the PoolSearch option, but you could try it with the !poolfind extension and the pooltag.

I've just chosen a random process, and then passed it as a parameter to the !alpc /lpp debugger extension to view which ports the process is connected to, and which ports were created by the process.

The address next to the process name appears to be the Process Address, and the first address (85eb9378) seems to be the Client Communication Port address, and the second address seems to be the address of the ApiPort. The !alpc /p extension helps to clarify this information. The 38 on the last line indicates the number of messages within the pending queue.

We can view message information with the !alpc /m extension:

The !lpc debugger extension documentation can be found in WinDbg, the !alpc extensions didn't have information, and therefore my assumptions on the fields were through investigation and knowledge from Microsoft related resources which will be added to the References section.

Common Issues:

By doing some research, I've manged to find some information on the common issues related to LPCs.
  • Servers aren't able to send messages for Clients which are waiting for a LPC Message.
  • There is no Timeout for LPC Wait APIs (this may have changed).
  • If the Server Process is terminated, then the Client Threads aren't notified unless there were Client Threads waiting for a reply from that Server Process.
  • The Server replied to the wrong Client, and the Server threads are completely deadlocked and thus can't process any more requests from Clients to a particular port.
You can find information related to LPCs/ALPCs by examining the stack function calls, and then using the debugger extensions to work backwards to find the Server Process which may be causing problems.

References:

LPC Communication
LPC (Local procedure calls) Part 1 architecture
LPC part 2 Kernel Debugger Extensions