I apologize for not updating my blog very regularly this month (it's been my birthday too), since I haven't been able to find any dump files which were interesting or useful to write about. I've wanted to post this particular example a few days ago, but couldn't find the thread again until now.
The example I wanted to write about was a Stop 0xE3, but since the post within the thread is already "blog material", I thought I might as well just post the link in this blog post.
BSOD dxgmms1.sys randomly
Tuesday, 30 July 2013
Wednesday, 24 July 2013
Exactly Why Are Page Faults Illegal At IRQL Level 2?
You may notice with Stop 0xA, Stop 0xD1 and Stop 0xC5, there always seems to be a illegal page fault or some other illegal instruction, although, page faults seem to be the most common.
To answer the question in the title, the answer is the the scheduler is turned off, therefore only non-paged pool can be accessed, since accessing memory which isn't available would lead to a page fault, which would then result in the thread being placed in a wait state with a context switch to a different thread being used, whilst the thread waited for the Memory Manager to process the page fault and make the memory address available. By changing to the contexts of different threads, then important data structures which are being synchronized at IRQL Level 2, would then need to be resynchronized.
Example - http://www.sevenforums.com/bsod-help-support/297605-bsod-when-playing-anything-0x000000d1-3.html#post2468537
Thursday, 18 July 2013
Debugging a Stop 0x9F Even Further - Using !drvobj
We're back with another Stop 0x9F to debug, in my opinion, these bugchecks are usually the easiest bugchecks to debug, since they usually point out the driver with the !irp extension, but sometimes the !irp extension may not reveal the true cause.
 The two parameters we're interested in are, parameter 2 and parameter 4. The second parameter specifies the physical device which the associated problematic driver belongs to, and the fourth parameter specifies the IRP which seems to be blocking any further progress.
 If we can examine the IRP, we can from the stack, that the driver which seems to be causing the problem is a Microsoft USB Hub driver, but from my experience, Microsoft driver are rarely the true cause for the crash.
So, let's debug deeper into the dump file (Minidump), and see which drivers are associated with the device. We can the !drvobj extension to view the associated drivers which control the device.
 We can now see all the associated Dispatch routines for that device, and the drivers which issue these routines, we can at the bottom a third-party driver which is related to theVMware USB Monitor driver, which seems to be potentially outdated. The driver's associated dispatch routine is IRP_MJ_PNP, this major function code is used to request when PnP activity should occur.


So, let's debug deeper into the dump file (Minidump), and see which drivers are associated with the device. We can the !drvobj extension to view the associated drivers which control the device.


Monday, 15 July 2013
Debugging a Stop 0x9F - Power Transistion Time Out
I've previously explained how to debug a Stop 0x9F with a blocked IRP, although, there is a different situation when the !irp, !devobj and !devstack extensions are not viable option for debugging. This is because the cause of the crash is slightly different.
 From the parameters provided by the bugcheck, we get a general idea of the problem, and what happened, basically a thread was holding a lock, which wasn't released, causing the synchronization to time out.
From my understanding, the lock was never released by the thread, since it's wait wasn't satisfied, it wasn't able to obtain the objects it was waiting for.
We can view which objects the locked thread was waiting for, with the !thread extension and parameter 3.

We can see that the thread is waiting for three Event objects, which are all Notification Events,
the thread is waiting for the completion of a certain event of procedure, once this has become complete, the Event objects will switch from Non-Signaled to Signaled, and will release the thread(s) from it's waiting state. Once a thread has left it's wait state, then it can resume it's normal operations.
From the call stack, there is further evidence to support that thread holding the lock is waiting for multiple Event objects: nt!KiCommitThreadWait and nt!KeWaitForMultipleObjects.

Events can be exposed to Device drivers, so let's check which drivers may be causing the thread to wait. I dumped the raw stack of the current thread we were viewing, and found a very outdated ATI graphics card driver.
 Two useful data structures you could use in a situation like this are: nt!_DISPATCHER_HEADER and nt!_KOBJECTS. The type field of the Dispatcher data structure will correspond to the a value within the Objects data structure, which in turn will indicate the type of object the thread is waiting for.
References:
http://msdn.microsoft.com/en-us/library/windows/hardware/ff553202%28v=vs.85%29.aspx

From my understanding, the lock was never released by the thread, since it's wait wasn't satisfied, it wasn't able to obtain the objects it was waiting for.
We can view which objects the locked thread was waiting for, with the !thread extension and parameter 3.
We can see that the thread is waiting for three Event objects, which are all Notification Events,
the thread is waiting for the completion of a certain event of procedure, once this has become complete, the Event objects will switch from Non-Signaled to Signaled, and will release the thread(s) from it's waiting state. Once a thread has left it's wait state, then it can resume it's normal operations.
From the call stack, there is further evidence to support that thread holding the lock is waiting for multiple Event objects: nt!KiCommitThreadWait and nt!KeWaitForMultipleObjects.

Events can be exposed to Device drivers, so let's check which drivers may be causing the thread to wait. I dumped the raw stack of the current thread we were viewing, and found a very outdated ATI graphics card driver.

References:
http://msdn.microsoft.com/en-us/library/windows/hardware/ff553202%28v=vs.85%29.aspx
Debugging Counterfeit Installations - Why I Don't Bother With Them
Note: This article is my opinion, and isn't intended to offend anyone [Point 3]
Although this blog post, is not exactly a tutorial or a link to a tutorial, I would like to explain why I don't even consider debugging a counterfeit installation and why you shouldn't either.
Effectively, most counterfeit installations take advantage of some exploit or apply some hack to bypass the activation requirements for Windows, this may explain to some of you, how you might notice a OEM_SLP key on a retail motherboard.
I'm assuming you know how to tell the difference between a counterfeit and geniune installation, therefore I'm just going to describe some of my reasons for not considering counterfeit installs to be worth debugging.
Firstly, counterfeit installations have key Windows files altered, in order to make the installation work, although, this can lead to most people having Windows Update difficulties. If the installation is not within it's original state, then it could give very misleading BSODs or crashes. For example, Stop 0x124's are handled by WHEA, part of the operating system, a corrupt driver could be the cause, but instead the cause is given to some hardware component, such as a data read from the Level 2 cache.
Secondly, counterfeit installations have many vulnerabilities and stability issues, the installation could easily be at fault and cause of the all the problems, if it can't handle basic tasks or procedures required by device drivers. The installation is most likely to be infected with some malicious software or code, causing further instability, if you able to resolve instablity at this moment in time, the same problem is very likely to repeat itself in the future.
Thirdly, and this may be slightly discriminatory, but from my experience, the user with the counterfeit installation, is usually very rude, impatient and wants a "quick fix" for their problems. The users I have had, mostly feel they are "smarter" than you, and will discount the installation as being the problem, and will begin to become abusive or impatient.
Most forums will not even accept counterfeit installations. Some users are completely unaware of their counterfeit installation, and will often be thankful for pointing it out to them. If you are victim of a having been sold a counterfeit installation, and can prove you were completely unaware, then I believe Microsoft can help you with it.
Friday, 12 July 2013
Basics of the Windows Driver Model
According to the Windows Driver Model, there are three different kinds of drivers, which will operate within the driver stacks etc. These types of drivers are: Bus Drivers; Filter Drivers and Function Drivers.
The bus drivers are typically already provided by Microsoft, they are as the name suggests, used to communicate with the various different buses on the motherboard, for instance the pci.sys for PCI/PCIe devices.
The function drivers, provide the operational side of things for the device, and is used to manipulate the device and it's operations. The driver will handle tasks, such as reads/writes and power management states for the device(s).
The filter drivers are used to add greater functionality to a device, and are used to modify I/O requests and respond to other device driver responses, as an example from the Windows Internals book, they can be used to modify any mistakes made by the hardware regarding the amount of required resources.
Monday, 8 July 2013
Debugging Stop 0x1A - MEMORY_MANAGEMENT
Thanks muhahaa for pointing the PFN data structure out to me.
A Stop 0x1A is quite common in my opinion, and usually is caused by two things: device drivers and RAM. Although, other causes can include the Windows Kernel and memory located in other areas.

Firstly, looking at the parameters presented to us by WinDbg, we can see that the first parameter usually indicates the type of memory management violation which has occurred.
From this example, 41790 indicates that a page table page has become corrupt. The page table is used to store mappings between physical and virtual memory addresses.
We can see from the call stack for the thread, that some virtual memory related routines were being called by the Windows Kernel, for instance the nt!NtUnmapViewOfSection is used to view the unmap the view (mapping of a section object in virtual memory for a process) from the virtual memory address space for a process.

The interesting thing about this dump file is the third parameter, which is 0xffff, this is very similar value when a device driver has called MmUnlockPages too many times on a MDL, which causes the reference count for the number of PFN entries to drop below zero.
We can view the data structure for a PFN database and check the reference count:

We can see that the number of Used Page Table Entries reference count has dropped below zero, here my suggestion would be to use Driver Verifier along with the Special Pool option.
Deferred Procedure Calls - DPCs
In this blog post, I thought I would attempt to explain what are DPCs.
DPCs are a type of software interrupt, which is used to form a type of synchronization within the kernel, DPCs are only active the current IRQL level for the thread is at IRQL Level 2 (DISPATCH_LEVEL).
We can use the !irql extension to gather what the IRQL level is for the current thread.

DPCs can be used to give device drivers routines higher priority over other tasks, by sending a DPC request to the kernel, which then creates a DPC object for the device driver; the DPC object is then added to the DPC queue. DPCs are also used for thread dispatching.
This DPC object is only visible to the kernel, and will contain the address for the function which will need to be called when the kernel begins to process the DPC queue. Each process has it's own DPC queue, and each DPC request has it's own set priority, by default this priority is medium, however, the device driver can change it's priority within the queue. High priority DPCs are processed first, then medium and then low priority DPCs.
All the DPCs queued will be executed until the queue is empty, or a higher priority interrupt occurs. Typically, the routine used for completing the DPC queue is nt!KiRetireDpcList.
We can view the number of queued DPCs and the priority for each DPC object with the !dpcs extension, we can specify the processor using the processor number, or just type !dpcs to gain the DPC queue for all the processors.
On the other hand, if a DPC is targeted at different CPU (different to the processor with the ISR), and the currently waiting DPCs have high or medium priority, then a Inter Processor Interrupt (IPI) is sent to the targeted CPU to process it's DPC queue, although this can only occur if the CPU is idle. The !ipi extension can be used to investigate the IPI state for a certain processor or the all the processors.
If the DPCs within the queue have low priority, and then the DPCs are queued until the threshold is met like before.
References:
http://forums.guru3d.com/showthread.php?t=377960
http://analyze-v.com/?p=598
DPCs are a type of software interrupt, which is used to form a type of synchronization within the kernel, DPCs are only active the current IRQL level for the thread is at IRQL Level 2 (DISPATCH_LEVEL).
We can use the !irql extension to gather what the IRQL level is for the current thread.
DPCs can be used to give device drivers routines higher priority over other tasks, by sending a DPC request to the kernel, which then creates a DPC object for the device driver; the DPC object is then added to the DPC queue. DPCs are also used for thread dispatching.
This DPC object is only visible to the kernel, and will contain the address for the function which will need to be called when the kernel begins to process the DPC queue. Each process has it's own DPC queue, and each DPC request has it's own set priority, by default this priority is medium, however, the device driver can change it's priority within the queue. High priority DPCs are processed first, then medium and then low priority DPCs.
All the DPCs queued will be executed until the queue is empty, or a higher priority interrupt occurs. Typically, the routine used for completing the DPC queue is nt!KiRetireDpcList.
We can view the number of queued DPCs and the priority for each DPC object with the !dpcs extension, we can specify the processor using the processor number, or just type !dpcs to gain the DPC queue for all the processors.
DPCs and Processors
In usual circumstances, the DPC queue is processed when the IRQL level is 2, along with a software interrupt (nt!KiDispatchInterrupt), but this only occurs if the DPC is targeted at the current processor (the processor with the Interrupt Service Routine), and the DPC has a high priority, otherwise it is queued until the number of allowed queued DPCs raises above the threshold.On the other hand, if a DPC is targeted at different CPU (different to the processor with the ISR), and the currently waiting DPCs have high or medium priority, then a Inter Processor Interrupt (IPI) is sent to the targeted CPU to process it's DPC queue, although this can only occur if the CPU is idle. The !ipi extension can be used to investigate the IPI state for a certain processor or the all the processors.
If the DPCs within the queue have low priority, and then the DPCs are queued until the threshold is met like before.
References:
http://forums.guru3d.com/showthread.php?t=377960
http://analyze-v.com/?p=598
Tuesday, 2 July 2013
Debugging Stop 0xC2 - BAD_POOL_CALLER
Generally, a Stop 0xC2, indicates that a thread was making a bad pool request, this request is dependent upon the parameters. In this example (currently still be debugged), the parameters indicated that the thread was attempting to free a region of pool which was already freed.
The usual causes are either device drivers or memory.


The usual causes are either device drivers or memory.
Firstly, I checked for any pool corruption with the !pooval extension with the address of the pool block from parameter 4.
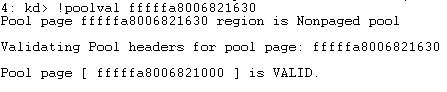
There didn't seem to be any possible pool corruption within the page of non-paged pool which was good, thereby I believed memory isn't likely to be an issue as of yet.

Using the !pool extension, I was able to investigate further if there was any possible pool corruption, the right column indicates the pool tags and the left column indicates the if the pool was free or allocated. The Previous Sizes all matched, which lead to me believing that this pool page wasn't corrupted.
The * next to the Pool Tag Even indicates that the debugger found the address matching the address used with the !pool extension. The Protected is a check to ensure that the allocation being freed is the intentional one.
From the other information I could gather, the ExFreePoolWithTag routine was present, which then indicates that a pool address was being freed, since the Even tag was the pool tag being freed and was Protected. I believe that the Even tag wasn't supposed to be freed, hence the bugcheck.
The Even tag, from some searching, appears to be linked to Event Viewer.
References:
http://msmvps.com/blogs/windrvr/archive/2007/06/15/tag-you-re-it.aspx
http://analyze-v.com/?p=734
Debugging Stop 0xA - IRQL_NOT_LESS_OR_EQUAL
Today, I thought I would explain how to debug a Stop 0xA. Typically, this bugcheck is caused by device drivers.

From, the image above, we can see the memory address being referenced and the current IRQL level. Let's see where the memory address being referenced is located.
By obtaining a Stack Trace with the kv command, I was able to find what the cause of the bugcheck was. There seemed to be multiple page faults, we can't be handled by the MmAccessFault when the IRQL level is 2 (DISPATCH_LEVEL) or above, and therefore are illegal operations.

Obtaining the registers for the trap frame for one of the Page Fault, revealed some useful information, the IopCompleteRequest created a Page Fault within the system, and we can see that the function was pointing to the rcx register which was the memory address being referenced from the first parameter.
In my opinion, the cause seems to be likely to be drivers from the above information, however, it turns out that the problem may have been a failing hard-drive.
It also turns out that the address regions for two drivers overlap each other.
|
Subscribe to:
Posts (Atom)