Saturday 30 November 2013

Debugging Stop 0xC4 - Invalid Handle [Updated Version]

Again, this is a updated version of a previous blog post, since I will able to show things in more depth. This is a bugcheck caused by Driver Verifier finding a violation, it indicates that a process or driver has used a User-Mode handle in Kernel-Mode.

I've highlighted the two parameters which are the most important in this bugcheck. The value of the handle, and the address of the current process. Since this is a Driver Verifier bugcheck, the driver is most likely going to be displayed, so this post is more about understanding what it references and what it did wrong.

By using the !process extension, we can dump some information about the process, and view the number of handles it currently holds.

Using the !handle extension with the value of the handle being referenced in parameter 3, gives some information about the object which the handle is currently referencing. It seems to be a registry key.

Let's take a closer look into the registry key, just for academic and nerdy interest, use the !reg findkcb extension with the entire path of the registry key.

Using the address of the KCB (Key Control Block), use the !reg kcb extension, and should get output similar to this:

The reference count is 1, therefore only one process has a handle open to that registry key. The Flags indicates the name of the key is in a compressed form, and the registry key is current 9 levels deep into the registry. \REGISTRY\MACHINE\SYSTEM would be 3 levels.

The nVidia graphics card driver seemed to be causing problems. The registry key being referenced is also related to nVidia.

Friday 29 November 2013

Understanding Splay Trees

Splay Trees are an example of a binary search tree, which is a data structure for arranging and sorting data, which is sorted into nodes. They make good use of pointers. Splay Trees share the same structure as a standard binary search tree, but provide benefits such as the most accessed node always being the root or top of the tree. There three standard algorithms for splaying the node to the root of the tree, and these depend upon the positioning and depth of the node within the Splay Tree.

Splay Trees are used in IFS (Installable File Systems).

The length of the time taken to complete a algorithm for a Splay Tree, can be calculated with the Big O notation. There's no randomisation within Splay Trees, and therefore some operations can be expensive and time consuming, this is especially true when Splay Trees become unbalanced and very tall. It could take many Zig operations to splay a node to the root of the tree. Each rotation is called a Splay Step, and the process is called Splaying.

Here is an example of a very tall Splay Tree:


Let's discuss the three algorithms, used to search or walk through a Splay Tree, and then Splay this tree to rebalance it.

Zig Zag Algorithm:

The algorithm, begins like a ordinary binary search tree, you start at the root, and then begin to walk down the tree, deciding if you take the left child or the right child of the current grandparent (root), depending upon the data sorted within the node your looking for. You continue this process, until you come across the node and the key your looking for, or until you reach a dead end, since the node may not be sorted within the search tree.

 The general rule here, is if x (node) which we are splaying up the tree, is the left child of right child, or the right child of the left child. It's easier to understand it, in a picture or in a video.


Zig Zig Algorithm:

The node (x) is left child of the left child, or right child of the right child. The Parent is rotated through the Grandparent, before the splay of the node takes place. The Grandparent is the root of the tree, and the Parent is the child which the node is the child of: right child of the right child.


Zig Algorithm:

This is the most easy algorithm, the node (x) is the child of the Grandparent or the root.


Splay Tree Node Insertion:

Now, let's discuss the Insertion and Deletion of nodes within a Splay Tree. The general rules apply to a binary search tree, and since a Splay Tree is a binary search tree, it inherits these properties. You can use your own defined relationships (properties) with the insertion of new nodes.
  • The left subtree of a node is less than the key stored in the Parent node.
  • The right subtree of a node is greater than the key stored in the Parent node.
  • There can't be any duplicate nodes. 
Remember the Parent Node, would the node above the subtree. All subtrees must be binary search trees too.  A key typically refers to the data stored within the tree.


This Splay Tree contains one node, with a data value of 60. It is the Root Node, and as a result will not have any associated Parents, but it doesn't have any children either. Until, we insert another node into the Splay Tree. RtlIsRoot can be called to decide if the current node is the root node, or techically the Grandparent node. Each node contains usually three different pointers. The Parent, Left Child and Right Child.

RtlSplay is used to call, and add a node to the Splay Tree, and rebalance the Splay Tree, so the node becomes the root.


This process can continue with the adding of new nodes. Remember you will need to call
RtlInitializeSplayLinks, to create a new link between the newly inserted node and the original node, before even adding the node to the tree and calling other routines.

Splay Tree Node Deletion:

A node can be deleted with the RtlDelete, which deletes a node and then splays the tree. You can specify not to re-balance the tree, with the RtlDeleteNoSplay.


Synchronization in Splay Trees:

 This really depends upon the IRQL Level, if your going to need to raise the IRQL Level to greater or to DISPATCH_LEVEL (IRQL Level 2), then spinlocks must be used along with non-paged pool. Otherwise, if lower than DISPATCH_LEVEL, then general dispatcher objects can be used along with paged pool. 

References: 

Kernel Mode Basics: Splay Trees

Binary Search Trees

Binary Search Trees - Wikipedia

Splay Tree - Wikipedia

All the routines should be fully documented within the WDK. 

Understanding Stop 0x9F - How it Works

I've explained how to debug a Stop 0x9F in previous blog posts, but here I'm going to explain how exactly it detects a timeout, and thus bugchecks with the Stop 0x9F.

We should understand now, that the two highlighted parameters are the most important for this type of bugcheck. The fourth parameter shows the Blocked IRP which caused the timeout, and the second parameter is the PDO of the device the driver is associated with.

Lets look at the blocked IRP, using the !irp extension.

So, we can see that a power related IRP is pending, and has held too long by a device object leading to the crash. tunnel.sys seems to be associated with the IRP, however, this isn't the exact problem here.

We can see that tunnel.sys calls GsDriverEntry, which is a routine called after the driver is loaded and initialized. It take two parameters: a pointer to the DRIVER_OBJECT data structure, and a pointer to the path in the registry where the driver is stored. It's called at IRQL Level 0.


The ndis.sys calls the the driver unload routine, which deallocates any pool and then unloads the driver. The ndis.sys driver then handles all the dispatch routines. ndis.sys is handled by a Microsoft Miniport driver, since IRP dispatching routines are mostly generic, and can be very difficult to code. 

 I'm not exactly sure what the ndis!ndisDummyIrpHandler does, but a dissembly shows a pointer to the WPP, which is used for software tracing.


It seems to mostly push some data stored in the registers onto the stack.


The device instance seems to point to Teredo, which is used for IPv6 connectivity for IPv4 Internet connected computers. I think we can establish there is something definitely network connected, and it's possibly related to the adapter of some sort.

Now, let's get to the main point of discussion, the call stack which demonstrates how a time out is detected with a driver.


Looking at the stack, as we can see a timer has expired, which is shown with nt!KiProcessExpiredTimerList. We can view all the pending timers on a system with the !timer extension, for demonstration purposes, this was taken from a different dump file. The timer which would have been expired is the nt!PopCheckForIdleness.


So, when the timer expires, it calls the nt!PopCheckIrpWatchdog with nt!PopIrpList routine which searches through the IRP queue. Each time the nt!PopCheckIrpWatchdog is called, it increments a counter, when the counter has threshold has been exceeded, the system bugchecks with Stop 0x9F.


To find the driver which was causing the problem, I had to search the raw thread, it seems to be a very old network adapter driver. I believe it was related to Intel.


References:


Debugging Bug Check 0x9F: DRIVER_POWER_STATE_FAILURE

Thursday 28 November 2013

Debugging Stop 0x4A [Updated Version]

Like before with the Stop 0x101, I'm going to provide a updated version of a Stop 0x4A which will contain some more information.

We should all understand what IRQL Levels and the differences between Kernel-Mode and User-Mode. The general nature of this bugcheck indicates that the a thread has returned to User-Mode from Kernel-Mode at a IRQL Level greater than Level 0 or PASSIVE_LEVEL. All User-Mode runs at IRQL Level 0.


System Service Calls are interrupts, and are handled by the System Service Dispatcher. We can view the IDT, and see which interrupt vector the System Service Dispatcher is stored at.


You could also use the rdmsr (read Model Specific Register) with the address of 176, to view the sysenter instruction handler which is used on modern processors. The IDT is more backwards compatibility for older processors. The sysenter instruction is executed and enabled transition into Kernel Mode. The sysexit instruction is used to exit Kernel-Mode, and return to User-Mode. In some circumstances, like when the Single Step (or Trap) flag has been enabled, the iretd (Interrupt Return) instruction may be used instead.

In this instance, the flag is disabled and not set:


The Trap flag causes the processor to execute one instruction and then stop. This can cause a crash if used with the sysexit instruction.

Check Volume 3 Chapter 35 in the Intel Developer's Manual for more information about MSRs.

The syscall and sysret are used to call and return from System Calls stored within the System Call Descriptor Table. The System Call Number which is used to look in the SSDT and execute the System Call routine is stored within the eax register. The parameters of the call are stored on the Kernel Stack of the thread to prevent modification from User-Mode.

We can view the SSDT here:


On x86 systems, these structure can be hooked onto and patched.

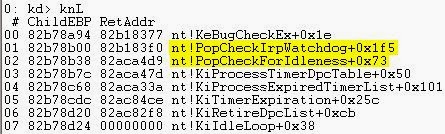
Getting back to the topic of the thread, it appears that the IRQL Level is 2.


I also went and checked the last process, we seems to point to Bitdefender. I've seen Bitdefender directly cause a bugcheck like this before.


Additional Reading:

User-Mode Interactions: Guidelines for Kernel Mode Drivers

Hooking Shadow SSDT on Windows 7

Debugging Stop 0x101 [Updated Version]

Okay, I know I've previously explained a Stop 0x101 beforehand, before like a Stop 0x124, I'm going to provide a updated version. Remember you'll need a Kernel Memory dump in order to carry this out.

The third parameter contains the PRCB address of the hung processor, the fourth parameter is in fact Reserved, but does contain the processor number of our hung processor. Microsoft like to make us work a little harder.

Using the !prcb extension with the processor number, you'll notice that the PRCB address matches the address of the hung processor. 

We can also tell that Processor 0 sent out the Clock Interrupt, since the IRQL Level is set to 13. This applies to x64 systems. On a x86 system, the IRQL Level is 28. Clock Interrupts are also hardware interrupts.


We can dump the IDT (!idt), and then see which interrupt vector clock interrupts and IPIs are assigned to.


Okay, we know that Processor 0 sent out the Clock Interrupt, so let's dump the call stack with the knL command, which does the same job as the k command but adds frame numbers.


The Clock Interrupt was sent to update the system time, and keep synchronization. Well, that would have been the purpose if Processor 2 responded in time.

You may also be wondering why I highlighted the IpiInterrupt, well if you look at the nt!KxFlushEntireTb and nt!keFlushMultipleRangeTb routines, these require the use of a IPI (Inter Processor Interrupt) to clear the TLB cache. The the main purpose is again, synchronization. We can view the IPI, and gather further evidence that the Processor 2 is hung with the !ipi extension.


Now, let's finally examine the Processor 2 stack, and it's activity.


There doesn't seem to much activity going on here. This is usually because the processor, couldn't be interrupted and a context gathered, thus the reason for the registers also being completely empty.


Instead, we need to use the !thread extension and then gather a raw stack with the dps command. The !dpx doesn't seem to work well here, since it can't gather a stack pointer.


dps fffff88007fb1000 fffff88007fbc000

 Any a hardware interrupt, any previous activity will be deferred and linked with a DPC. We can examine the DPC Queue with !dpcs extension. This enables the CPU to complete any high level processing to be completed quickly.


I also noticed a interesting routine in the raw stack:


The nt!KiDpcInterruptBypass is used to ignore any DPCs, and continue processing.

Looking through the raw stack, I noticed two third-party drivers which may have lead to a stack overflow, thus the reason for nt!MiCheckForUserStackOverflow. I also couldn't see any evidence of the IPI being processed at all on Processor 3, such as
nt!KiIpiProcessRequests and nt!KiIpiInterrupt. 

Just to quickly add, the Interrupt Flag was set to true (1), and therefore the processor was able to handle hardware interrupts, and the Clock Interrupt was received on the processor, since the system time was updated. IPI's have a higher IRQL Level than Clock Interrupts, and therefore will have higher priority, I believe the processor was waiting upon the IPI completion, which seemed to have never completed, and then a Clock Interrupt was issued within the wrong interval.


References:

Debugging a CLOCK_WATCHDOG_TIMEOUT Bugcheck

Class 101 for 0x101 Bugchecks


Wednesday 27 November 2013

How WHEA Works Internally

After this blog post, I think I've covered all the aspects of a Stop 0x124. Otherwise, you may see a few more posts about it in the future. I'm also planning on adding a few more debugging extensions, and will provide a updated version of a Stop 0x101.

WHEA General Structure and Reporting:

WHEA has the following general component structure:


LLHEHs are used to perform hardware error source discovery, gather information about the error source in the form of Hardware Error Packets, and then notify the operating system of the error. The Windows Kernel then formats these Hardware Error Packets into Error Records.

Here is the general format of a Error Record for WHEA:


 Each Error Record is described by the WHEA_ERROR_RECORD structure which provides information about the error condition. This is then saved in the Event Log through ETW (Event Tracing for Windows).

When a error condition has happened, the LLHEH may communicate with the PSHED to receive platform specific information for that error condition.

Hardware Error Classification

There are two types hardware error groups: corrected and uncorrected. These classifications are quite self explanatory, but I'll explain them nevertheless.

Corrected Errors: These are errors which have been corrected by the hardware, the operating system is then notified of this correction.

Uncorrected Errors: These are errors which can't be corrected by the hardware, and therefore fall into a further two different categories: Fatal and Non-fatal.

Fatal: Uncorrected error which can't be corrected by the recovered by the hardware, and will result in a bugcheck.

Non-Fatal: The errors can be attempted to recovered by the operating system, however, failure to do so will result in a bugcheck.

Error Sources

Error sources refer to the hardware which located a hardware error, they do not necessarily mean that the error source is the problem. At boot, the PSHED (Platform Specific Hardware Error Driver) returns a list of WHEA_ERROR_SOURCE_DESCRIPTOR structures to the Windows Kernel to indicate all the supported error sources for that hardware platform. With this information, the operating system is able to load and set up the necessary LLHEHs (Low Level Hardware Error Handlers) for the hardware error sources.

The hardware platforms for x86 and x64 are:
  • Machine Check Exceptions
  • Corrected Machine Checks
  • Non Maskable Interrupts
  • Boot Errors
The PCIe AER error sources are discovered by the PCIe Bus driver, and isn't discovered by the PSHED.

The general structure is as follows:


The Type member indicates the type of error source. ErrorSourceID indicates the unique identifier for the error source. More information on this structure can be found in the WDK documentation.

The union lists all the descriptors for a specific error source.


Tuesday 26 November 2013

Debugging Stop 0x124 - !sysinfo, !cpuinfo, !whea and !errpkt

Another blog post about Stop 0x124, as always said, these bugchecks are probably one of the hardest to debug due to the lack of information they retain, thereby it's very important to understand how to gather as much as possible from these seemingly barren dump files. I'm going to explain the rest of the !sysinfo extensions, !cpuinfo, !whea and !errpkt.

In regards to !sysinfo, I'm going to discuss the flags to the extension highlighted with the red box.


Let's begin with the !cpuinfo extension, which will show some basic information about the CPU. By default, it will display information about all the processors in the system, however, since this is a Mindump so one processor; the processor which was last running will be shown.

The MHz field shows the clockspeed of the processor. The Manufacturer field is used to show that the processor is a real Intel processor.

The CP field shows the current processor number. The F indicates the processor family number; the M indicates the processor model number and the S indicates the stepping size.

A processor family (F) is a form of categorisation used by CPU vendors to group their products, and therefore make comparison of the different features between processors of a similar feature set much easier. In a debugging sense, this just makes it easily to identify the processor, and find the relevant documentation for it.

The Model number is shows the specific type of processor within that family.

 The Stepping Size (S) is the version number of a CPU. 

The MSR (Machine/Model Specific Register) Signature Features is used to show the set debugging features and performance monitoring. It can refer to any of the Control Registers used. These are usually displayed as cr8 or a another number. See Volume 3 Chapter 35 of the Intel Developers Manual.


The !sysinfo cpuinfo extension is used to display similar information.


The !sysinfo cpumicrocode shows the processor family, model and stepping information.
This only works for Intel processors.


The CPUID string shows the name of the processor, and the MaxSpeed and CurrentSpeed of the processor. This is very useful for checking for overclocking.

The !sysinfo gbl used to provide ACPI Table information, and only works on systems which support ACPI. The ACPI Specifications can be found here - ACPI - Advanced Configuration and Power Interface


The !sysinfo machineid extension is used for displaying basic motherboard and BIOS date information.


The !sysinfo registers extension is used to display information about the MSRs, here I would consult the Intel Developers Manual to gather more information. This extension only works on processors which are not Itanium processors.


The !sysinfo smbios extension explains information related to the BIOS, such as memory, BIOS Version information, processor information and power information.


Again, the above is only a partial view of the extension due to size limitations. This only works on systems which support SMBIOS.

The !whea extension never seems to produce much with a Minidump, since it's part of the higher levels of the WHEA structure and therefore I'll advise to check the WinDbg documentation.


The Error Source indicates the hardware which notified WHEA of the hardware error condition. This do not mean that the Error Source is necessarily the culprit of the crash.

 There is also the !errpkt extension which displays information about a WHEA Hardware Error Packet, however, this information is converted into a WHEA Error Record (!errrec) by the Windows Kernel, by being given the Error Packet from the LLHEH (Low Level Hardware Error Handler).