Showing posts with label System Security. Show all posts

Saturday, 9 August 2014

Windows Access Tokens - !token and _TOKEN

Windows needs to ensure that untrusted code and untrusted users aren't accessing important areas of the operating system, and creating problems which would ultimately lead to a vast number of BSODs.

Windows manages this through Access Tokens which are used to identify the security context of a process/thread and a user. Access Tokens take two main forms: a Primary access token and a Impersonation access token. The Access Token additionally has two important features which are integral to security validation: SIDs (Security Identifiers) and a Privilege Array which contains the privileges allowed for that object.

The token type can be found within a enumeration called TOKEN_TYPE. 

 The data structure can be found under the TokenType field within the _TOKEN structure. The Primary type determines the security context of the process for the currently logged on user, and the Impersonation type allows a thread to temporarily use a different security context.

The Token type can also be found using the !token extension:

We can view the Privilege Array within WinDbg, by using the !token extension with the address of the access token for a given process, the Privilege Array can be seen below:

As mentioned before, the SID is used to determine if a thread or process has access to an object, and the privilege array will determine what that process or thread is able to do with that object. For example, being able to read and write to a file object.

SIDs have a unique format, and each segment will provide some useful identity information. Each SID will be stored with a _SID data structure as shown below:

 These fields can be found within a SID, for which I will demonstrate in a moment. Each SID will have a S prefix. If you know the address of a SID, then you can use the !sid extension to translate the address into the appropriate SID.


The three numbers in yellow, and in preceding in chronological order, represent the use of the SID, the revision number and identifier authority. The blue represents the sub-authorities and the green represents the RID or relative identifier.

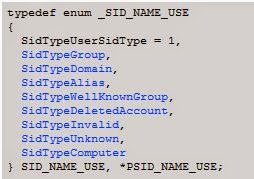
The SID use can be found within an enumeration called SID_NAME_USE. The 1 indicates that this is a User SID.


The sub-authorities belong to the identifier authority, and used for more unique identification. The identifier authority or issuing authority tends to be Windows.

The relative identifier is used to identify the SID in relation to the issuing authority. Each unique user or group will start at 1000, and for each new user or group, then this number be incremented by 1, therefore there is at least two users on this system. Administrators are typically given 500 and Guest accounts are given 501.

Primary and Impersonation Tokens have two subtypes: Restricted Tokens and Filtered Admin Token. A Restricted Token is derived from another access token with the following limitations:
  • Privileges can be removed from the privilege array.
  • The SIDs in the token can have their access altered.
 There is also a Filtered Admin Token which alters access rights, sets the integrity level to medium and most of the privileges are removed from the privilege array. 

I will conclude this article by describing some of the more interesting and helpful fields within the _TOKEN data structure.


TokenSource - The _TOKEN_SOURCE structure provides a information pretaining to the soruce of the access token. This can be the RPC server, Session Manager or LAN Manager.

TokenID, ParentTokenID and AuthenticationId - The Locally Unique Identifier (_LUID) is used to uniquely identify a access token from the many other potiental access tokens being used on the system. See the _TOKEN_CONTROL data structure for more information.


Privileges - The _SEP_TOKEN_PRIVILEGES structure contains the array of privileges related to the access token.

TokenType - The _TOKEN_TYPE shows if the access token is a primary or impersonation token.

ImpersonationLevel -  The _SECURITY_IMPERSONATION_LEVEL is an enumeration of impersonation levels for the impersonation token. There is four different impersonation levels.


TokenFlags - This field contains any flags which have been set for the access token.

TokenInUse - Shows if the access token is currently being used.

SidHash, RestrictedSidHash - These two hashes for the SID have been added to prevent token stealing. These hashes are checked each time the token is used.

References:

SID Components (Windows)
Access Tokens (Windows)
Restricted Tokens (Windows)
Impersonation Levels (Windows)


Thursday, 31 July 2014

Windows Integrity Levels - Process Explorer and WinDbg

From Windows Vista onwards, Microsoft has placed a substantially greater focus on the security of the operating system, which is one of the areas most users will neglect and then later come to complain about. In this article I'm going to talk about Windows Integrity Levels, and how we can view this information in WinDbg and through some SysInternals Tools. In another article, I will going into more depth about access tokens and how they are used to increase system security.

These security measures were introduced since it was relatively easy to modify memory and remove any security identification, thus leads to code modification and injection being used to allow illegitimate access to important system data structures etc.

User-Mode processes often require the use of system services and system resources which reside within the Kernel-Mode. To stop any illegitimate access or any poor programming from creating havoc in Kernel-Mode, some security validation procedures have been introduced to Windows, these commonly are Integrity Levels and Access Tokens.

The Integrity Levels come in 5 different levels, with 4 being the highest and most privileged level.

Integrity Levels (Lowest to Highest):
  • Untrusted (0) - Blocks most write access to a majority of objects
  • Low (1) - Blocks most write access to registry keys and file objects
  • Medium (2) - This is the default setting for most processes when UAC has been enabled on the system.
  • High (3) - Most processes will have this setting if UAC is disabled and the currently logged on user is the administrator. Otherwise, administrative programs will have this setting with
  • System (4) - This is a setting reserved for system level components.
Integrity Levels are used to isolate privileged code and data from programs which do not have the correct access rights. The Integrity Levels are stored with a Access Token, which we can view in WinDbg with the _TOKEN data structure and also find with Process Explorer. Access Tokens are typically checked when a process requests access to a handle for an object.

Viewing Integrity Levels (Process Explorer):

If you haven't enabled the Integrity Level column in Process Explorer, then follow these simple steps:

Click View > Select Columns > Integrity Level > OK/Apply

Process Explorer
Viewing Integrity Levels (WinDbg):

Alternatively, we can view the Integrity Level of a process with WinDbg, and the viewing the _TOKEN data structure. I'm not sure on its effectiveness.


Using the Token Address with _TOKEN data structure, we can find the Integrity Level of the process.


Wednesday, 18 June 2014

List of Reverse Engineering and Debugging Tools

I may have created a small list of tools before, however, I would like to expand this list and provide some better descriptions for each of the tools listed. These tools are either completely free or have a limited free version which provides enough functionality for those like myself, who aren't professional security researchers, escalation engineers or get paid for doing reverse engineering/debugging. These tools can and are used by professionals and enthusiasts alike. If you have any recommendations then please add a link to the comments section.

WinDbg - Reverse Engineering/Debugging

This tool is my most favorite, it provides complete functionality for enthusiasts and is for free. There is a wide range of extension and commands for viewing data structures, memory addresses and call stacks. It can be used for both reverse engineering and debugging BSODs (Blue Screens of Death).

There is good documentation for WinDbg for finding hidden rootkits, examining data structures and looking at raw memory. Most of this information has been used in my blog for writing tutorials and adding my own information to. It can be used for static analysis and real-time analysis.

Link - Windows Driver Kit (WDK) and Debugging Tools for Windows (WinDbg)

OllyDbg - Reverse Engineering (User-Mode)

OllyDbg is a great tool for reverse engineering user-mode programs. This is a another standard tool if you wish to examine malware or would like to learn the PE structure. This tool is for free, and again is there is great documentation for learning how to use it. Please check the Blogroll section for such blogs.

The data structure being viewed is the _PEB data structure, which is stored at offset 0x30 in the FS register for x86 systems. It is primarily used for static analysis.

 Link - OllyDbg v.1.10


IDA Pro - Free Version

 This tool is used for reverse engineering, and widely used by professionals to my knowledge. This is a very powerful tool, and be used to examine libraries in the IAT and EAT, look at strings stored in memory and assembly instructions. There are tutorials available on their website.


Link - IDA: About


Analyze It!

This tool is great for displaying information about a specific binary file (static analysis).


I could only find the program hosted on Softpedia, but I'm sure that there wasn't any other programs bundled with the installation package.

Link - Analyze It! Free Download (Softpedia)


PeStudio

This is tool provides the same features as the other program, but with a simpler and cleaner UI and is easier to use in my opinion. It also has VirusTotal integration.


Link - PeStudio

Twitter - @ochsenmeier (Developer + Updates)

Hook Analyzer

The program enables you to hook to a certain active process, and then pull information from that process. It only works with Ring 3 (User-Mode) processes to my knowledge.
 

PE Bear

PE Bear is another static analysis tool for examining PE files, you can view file signatures and view packers which have been used.

 Link -PE Bear Blog

WinHex 

WinHex can be used for examining the hexadecimal format of files.


Process Explorer

Process Explorer is a Microsoft produced tool, which can be used for finding general information about active processes. It has Virus Total integration.

Monday, 21 April 2014

Introduction to Detecting Anti-Debugging Techniques

Malicious Software is able to detect if it's running within a debugging environment or a debugger has been attached to the process, and thus will not generate of it's malicious behaviors in order to avoid detection from the security analyst or whoever is attempting to debug the process. In this article, I'm going to describe some of the common anti-debugging techniques which are used to detect the presence of a debugger.

 NtGlobalFlag:

The NtGlobalFlag is located within the Process Environment Block (PEB) at offset 0x68 on x86 Windows, and at offset 0xBC on x64 Windows.

Windows 7 SP1 x86


The default value is always 0, and doesn't change when a debugger is attached to the process. There are several methods in which the NtGlobalFlag can be changed to detect the presence of a debugger. The NtGlobalFlag contains many flags which affect the running of a process.

The most common flags which are set with NtGlobalFlag when a debugger creates a process, is the heap checking flags:

FLG_HEAP_ENABLE_TAIL_CHECK (0x10)
FLG_HEAP_ENABLE_FREE_CHECK (0x20)
FLG_HEAP_VALIDATE_PARAMETERS (0x40)

I've spoken about the purpose of these flags in a previous blog post which can be found here. These flags can be checked to detect the presence of a debugger. The general code from CodeProject, for checking the above flags:
unsigned long NtGlobalFlags = 0;

__asm {

    mov eax, fs:[30h]
    mov eax, [eax + 68h]
    mov NtGlobalFlags, eax
}


if(NtGlobalFlags & 0x70)
// 0x70 =  FLG_HEAP_ENABLE_TAIL_CHECK |
//         FLG_HEAP_ENABLE_FREE_CHECK | 
//         FLG_HEAP_VALIDATE_PARAMETERS
{
    // Debugger is present
    MessageBox(NULL, TEXT("Please close your debugging " + 
               "application and restart the program"), 
               TEXT("Debugger Found!"), 0);
    ExitProcess(0);
}
// Normal execution
IsDebuggerPresent():

The IsDebuggerPresent() is a Kernel32 function which will return the Boolean value of True, if a debugger is attached to the process. It can be found by checking the IAT. 


It can check the BeingDebugged field of the PEB:

char IsDbgPresent = 0;
__asm {
     mov eax, fs:[30h]
     mov al, [eax + 2h]
     mov IsDbgPresent, al
}

if(IsDbgPresent)
{
    MessageBox(NULL, TEXT("Please close your debugging " + 
               "application and restart the program"), 
               TEXT("Debugger Found!"), 0);
    ExitProcess(0);
}
// Normal Execution
The CheckRemoteDebuggerPresent() is a similar function, and can be detected with the same method.

NtSetInformationThread() - Thread Hiding:

The NtSetInformationThread() function has a hidden undocumented parameter called ThreadHideFromDebugger (0x11), which can be used to prevent any debugging events being sent to the debugger. Debugging Events are events which will notify the debugger, these can be the creation of new threads; generation of an exception; loading and unloading of DLLs and creating child processes.

You can check if this function is imported in the IAT. PeStudio or a similar program like PeBear may check for this function.

Execution Timing:

This is a simple idea and is implies that the execution time when be slightly more with the presence of the debugger. This technique measures the execution time, and if slightly longer than usual, can imply the use of a debugger. The common instructions include:
  • RDTSC, RDPMC and RDMSR instructions.
  • GetTickCount(), GetLocalTime() and GetSystemTime() are all functions within the Kernel32 library.
Again, you can check if these functions are imported within the IAT.

Software Breakpoint Detection:

The instruction 0xCC - INT 3 is used  to stop the execution of the debugged process and then pass the control to the debugger. The instruction is saved before the implementation of the breakpoint. Any comparison instructions (CMP, CMPXCHG) which use this instruction as a operand are considered as a anti-debugging technique.