A Stop 0x133 is quite rare, and have seen it to occur more commonly on Windows 8.x and Windows Server 2012. It tends to be caused by a DPC Interrupt object causing a timeout and then leading to a bugcheck due to undefined system behavior. You'll also need a Kernel Memory Dump to be able to debug this type of bugcheck.
As you can see from the bugcheck description, the DPC has exceeded it's time allotment by one tick which is always the standard parameter for these types of bugchecks.
DPCs are Deferred Procedure Calls which will run at IRQL Level 2 or lower, and are used to defer I/O processing until a later time to avoid keeping the system at higher IRQL Levels. The DPCs can targeted at the current processor or a different target processor. Each DPC is stored within a queue which can be found within the PCR (Process Control Block).
The PCR base address is stored within the fs segment register on x86 systems, and the gs segment register on x64 systems. You can use the dg command to view the segment registers.
The Self field contains a 64 pointer to the flat address of the Processor Control Region. The field is called SelfPcr on older operating systems and stored at offset 0x1c.
The _KPRCB data strucutre contains a wealth of DPC related information, such as the Watchdog timer object, DPC Queue and the Timer Count and Limits.
The easiest method would be to use the !dpcs extension, and then view the DPC Queue.
The CPU field indicates the DPC Queue for the specified processor, the Type field indicates the type of the DPC and the _KDPC is the address of the DPC object data structure used to represent the DPC, with the Function field indicating the Deferred function to be called.
Each DPC is usually given a Medium priority by default, any Medium DPCs will be executed before Low priority DPCs, with Important DPCs have the highest priority. The DPCs are usually until IRQL Level 2, or the queue threshold for the number of DPCs is met.
On the other hand, if a DPC is targeted at different CPU, and the currently waiting DPCs have high or medium priority, then a Inter Processor Interrupt (IPI) is sent to the targeted CPU to process it's DPC queue, although this can only occur if the CPU is idle. The !ipi extension can be used to investigate the IPI state for a certain processor or the all the processors.
If the DPCs within the queue have low priority, and then the DPCs are queued until the threshold is met like before. All the DPCs queued will be executed until the queue is empty, or a higher priority interrupt occurs. Typically, the routine used for completing the DPC queue is nt!KiRetireDpcList.
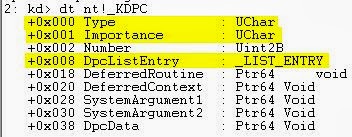
Now, let's investigate the _KDPC data structure, and examine some of it's fields.
There are three main types of DPCs: ISR DPCs, Custom DPCs and Threaded DPCs. This is what will be shown within the Type field.
ISR DPCs are used for handling I/O operations related to ISRs. The DPC will finish the I/O started by the ISR, remove the next IRP from the IRP Queue and then complete that IRP.
Custom DPCs have their own custom written routines or functions to handle, and Threaded DPCs which run at IRQL Level 0.
Threaded DPCs can't be preempted by any threads but will be preempted by a Normal DPC. Ordinary DPCs will stop the execution of all threads on that processor, and can stall execution of any threads on that processor for long periods of time leading to hangs, thus the reasoning for Watchdog timers.
The Importance is the priority levels discussed earlier, and the DpcListEntry is the doubly linked list for the DPC Queue.
There is one last important point to understand, and that is DPCs will run within their own stack, which can lead to complications if you wish to obtain the call stack of the thread rather than the DPC stack. If the system crashes within the DPC stack, then the default stack within the bugcheck will be the DPC stack and not the Kernel stack for the thread. I explained the types of stacks previously, but I would suggest reading Scott Noone's post here, to see how to obtain the address of the Kernel Stack from a DPC stack.
Now, that we have improved our understand of DPCs, we can investigate further into this bugcheck.
The problem starts with Remote NDIS USB driver, which was calling the CancelSendsTimerDpc.I believe that the driver uses a Custom DPC associated with a Timer object.
References:
Debugging Stop 0x133 - NT Debugging Blog
Windows Driver Kit Documentation


No comments:
Post a Comment