In the last blog post, we looked at the structure of Hive Bins and Hives, in this blog post I will looking into Cell Indexes and Cell Index Mapping.
Cells are containers for information, such as keys, thus the reason for the different type of cells explained in the last post. In order to make the logical structure of the registry clearer, it's important for me to state how all the different parts I've been discussing fit together to form one complete picture of the Windows Registry.
Hives are split into Bins, and the Bins are then split into Cells. A Empty Bin will not contain any cells, whereas, a Bin with Cells will obviously contains Cells which will contain registry data. This brings around the point about Cell Indexes and Cell Mappings, and some of the data structures will can explore with WinDbg.
Cell Indexes are essentially pointers which link cells from different hives together, to make easier and more efficient for the Configuration Manager to load information which it is searching for. More specifically, the Cell Index is a offset into the cell with the subtraction of the size of the base block for the selected hive.
The tables which the Cell Indexes are used to index into, can be found within the Storage.Map member of the _DUAL data structure of the appropriate _HHIVE data structure. We can expand the _DUAL data structure and examine this member.
The _HMAP_DIRECTORY is a array of pointers to table entries, which then contain the information for a specific Block and Bin. The FreeDisplay field is used to for free cells within memory.
Since Hives are allocated from Paged Pool, they will need to be mapped since paged pool isn't guaranteed to be contiguous. This leads to the concept of Cell Index Mapping, which is very much the same as Virtual Address Translation on x86 systems; remember that x64 had a additional table of directory pointers.
Using the diagram above, it may become more apparent what the pointers within the mentioned data structures are being used to index into. As we can see, the Directory Index pointer is being used to point to the Hive Cell Map Directory, which is then used to point to the Cell Map Table with a Table Index pointer, and then the Byte Offset is used to point to the specific Cell within the Hive Block.
There is a additional bit which is either 0 or 1, and is used to determine if the Hive is Volatile or Stable, and which table type to begin searching with. This translation is used for Hives in memory. 1 is Volatile and 0 is Stable.
Directory Index = 10 bits
Table Index = 9 bits
Byte Offset = 12 bits
Since Hives usually reside on the hard disk, and are then mapped into memory, in order to avoid excessive consumption of the Cache Manager's address space. The number of mapped views for a hive is limited to 256 views. The LRU (Least Recently Used) views list is consulted when this has been reached, and when a new mapping is required because the Configuration Manager requires a hive to be mapped into memory. The LRU mapping will be removed from the list. This data structure is allocated with Paged Pool.
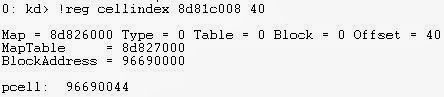
There is some interesting WinDbg extensions we can use to find additional information related to Cell Indexes such as the !reg cellindex extension.
The extension shows the virtual address associated with the Cell Index. The first address is the Hive Address and the 40 is the offset which we are looking for. I've used the SYSTEM hive in this example.
For additional information, I would suggest reading this thesis, which will be available on my One(Sky)Drive since I can't find the original download link. Just ignore the random pictures and other junk in my Public folder, the Ted Mosby picture is a inside joke about me.
Each Hive is divided into a number of allocation units called Blocks, the first block of a Hive is called the Base Block. The information which is stored within a Hive is then organized into Cells which contain active registry data such as keys, values, security descriptors and subkeys.
The Hive Blocks are allocated in 4096 byte allocation sizes, and are called Hive Bins. The Base Block may also be referred to as the Registry Header, with the other blocks being called Hive Bins. Each Hive Bin is then divided further into Cells as explained above.
A Hive Bin will have the hbin signature which can be found with WinDbg. Firstly, use the !reg hivelist extension, and then use the !reg viewlist extension with a desired Hive Address.
The !reg viewlist extension will list the Mapped Views for the selected Hive. I wasn't able to find a dump file which had any mapped views, therefore I won't be able to show you the steps completely. Once you have used the !reg viewlist extension, then use the db command with a desired view to view the contents of a bin.
The _HHIVE data structure seems to contain a Signature field and BaseBlock field as described earlier. Each Hive Bin contains a pointer to the next Hive Bin and the first Hive Bin. We can find free Hive Bins with the !reg freebins extension and the Hive address.
These Hive Bins are only really containers for Cells which hold registry information such as keys, security descriptors, subkey lists and key values. There a few different types of Cells:
- Key Cell
- Value Cell
- Subkey-list Cell
- Value-list Cell
- Security-Descriptor Cell
The Key Cell contains the registry key and may be called the Key Node. A Key Cell will contain the kn signature for Keys and kl for Link Nodes. Furthermore, the Key Cell will maintain timestamp information about the latest update to that key, and various Cell Indexes which will describe additional information.
The Value Cell contains information about the key's value, and will have a Cell Index into what the cell which contains such data about the key. The signature will be kv.
The Subkey-List Cell contains a list of Cell Indexes for Key Cells in which all share a common Parent Key.
The Value-List Cell is the same as above, but applies to Value Cells rather than Key Cells.
The Security Descriptor Cell will contain the ks signature and a reference count which maintains a count of the number of Key Nodes or Key Cells which share the Security Descriptor. This cell will contain a Security Descriptor.
We can view Cell data structures with the _CM_CELL_DATA and then using the -r switch to dump all the hidden sub data structures. The -r switch is really useful for data structures in general, especially since Microsoft won't document some sub fields fully.
Since we are the topic of keys, I thought it would be appropriate to look at the concept of Keys and how we can investigate into Keys further with WinDbg. We can firstly use the !reg openkeys extension, and then view any open keys. Please note that I've omitted the output of the extension to one Hive.
However, we can gather more interesting information by looking into a few data structures. Each key will have a Key Control Block (KCB), we can use the _CM_KEY_CONTROL_BLOCK data structure to view the information about the open key.
This is similar information to which can be found with the !reg kcb extension, you will need to use the !reg findkcb extension with the full registry path, in order to find the kcb address. However, with the open keys case, you can simply use the !reg kcb extension since the KCB address is already given.
The Configuration Manager maintains open keys within a table for fast name lookups, the table can be found with two global variables called CmpCacheTable and CmpHashTableSize. The CmpCacheTable is a pointer to a hash table which explains the _CM_KEY_HASH data structure within the KCB.
Each entry within the table is a pointer to the _CM_KEY_HASH data structure.
The NextHash field points to the next structure within the table.
In my next blog post I'll discuss Cells and Cell Index Translation.
The Registry is a key component of the Windows operating system, and it's always been recommended that you should never careless run Registry Cleaners or start to change keys or delete keys which do not fully understand the purpose of. You never to seem to find much information about the Registry in general, unless it's in Specialist blogs or computer science papers. In this blog post I hope to show how to explore the Registry using WinDbg and look at some of the internal workings.
The Registry tends to be referred less commonly as the Configuration Manager, and the Configuration Manager is the technical name for it. As the name suggests, the Configuration Manager mainly maintains the state of the configuration data for the operating system and any programs which may have been installed. The Registry is divided into several sections called Rootkeys. The Rootkeys are defined as follows:
- HKEY_LOCAL_MACHINE
- HKEY_CURRENT_CONFIG
- HKEY_CLASSES_ROOT
- HKEY_CURRENT_USER
- HKEY_PERFORMANCE_DATA
- HKEY_USERS
Each Rootkey has a number of Hives which are subdivided into Keys and Values. This can be seen when viewing the Registry with the Registry Editor.
The HKEY_LOCAL_MACHINE a important root key which contains other keys such as BCD (Boot Configuration Data), COMPONENTS, HARDWARE, SAM, SECURITY, SOFTWARE and SYSTEM. Any changes here will apply to the entire system.
The HKEY_CURRENT_CONFIG contains information relating to Hardware Profiles, which enables configuration driver settings. A Hardware Profile may change from boot to boot, and will be used by any programs which require it.
The HKEY_CLASSES_ROOT contains information for file extension associations, COM Class reregistration and UAC (User Account Control).
The HKEY_CURRENT_USER contains the configuration data regarding the locally logged on user. The Root Key is mapped to the Ntuser.dat file which is present on the hard drive. Some of the local configuration data examples include: Environment Variables, Network Settings, Software Settings and Session Information.
The HKEY_USERS contains data required each loaded user profile, and will be used by Winlogin to implement any specific user changes. This section will also contain keys relating to user security identifiers for that profile.
The HKEY_PERFORMANCE_DATA contains operating system and server performance counters, and will not be visible through the Registry Editor. These performance counters are only available through the Windows Registry API.
The HKEY is used to represent a handle to the rootkey. Now we have looked at the general logical structure of the Windows Registry, will need to examine it's actual implementation onto the hard disk. This is achieved through the concept of Hives, Cells and Bins. It is possible to be examine to parts of the Registry in Physical Memory.
The structure of a Configuration Manager Hive can be seen with WinDbg using the _CMHIVE data structure. It's a large data structure, and therefore I have omitted some of the fields.
The above data structure contains a larger sub structure called _HHIVE, which contains some very useful information. The _CMHIVE structure is allocated from paged pool, and has the pool tag of CM10. You can view this pool allocation information with !pooltag and !poolfind.
Using the !poolfind extension with the pooltag and specifying the pool type as paged pool with the 1 switch, we can see all the pool allocations for that specific pool tag.
A Hive is simply the on disk representation of the Registry, each one of these has it's own registry tree which serves as a root. The hives are then loads the Hives which can be found HKEY_LOCAL_MACHINE\SYSTEM\CurrentControlSet\Control\hivelist. These Hives are stored on the hard disk, and are then linked to the Registry file paths as seen below. Most of the hives reside in the System32 folder, whereas, the others will reside in the UserProfiles and Users folder.
Alternatively, we can view the Hivelist within WinDbg using the !reg hivelist extension. You may have noticed that the HARDWARE hive not does have a folder path, this is because it is updated every time the computer is booted, and therefore is only present within memory.
We can even view the current paged pool consumption of the Registry Hives using the !reg dumppool extension. Again I've had to omit some information due to the size limitations.
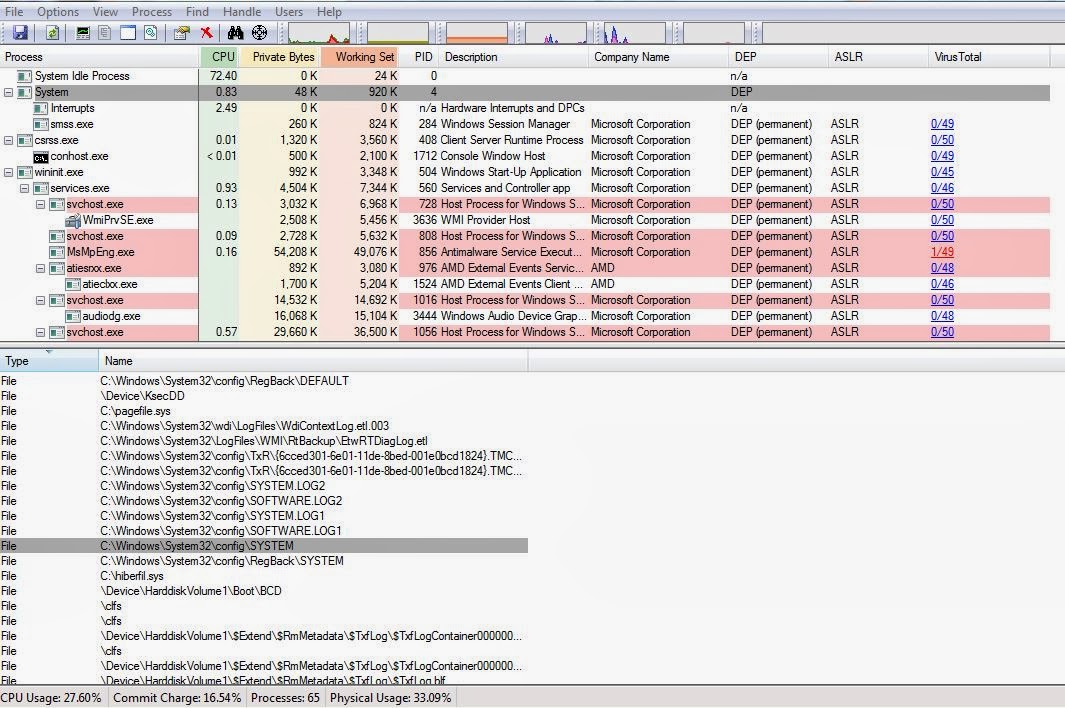
Using Process Explorer, and then selecting the System process, we can view the Hive Handles which are currently opened by the System Process.
Going back to the general structure of how Hives are organized, Hives are linked together within a doubly linked list, the Head of this linked list can be found with WinDbg, the address is 8336e44c on x86, I'm sure if there is any difference on x64.
We can also see this with the _CMHIVE structure and the HiveList field. The addresses within the linked list are all virtual addresses.
In the second part I have be taking a closer look at the structure of Hives and some more forensic analysis techniques.
As you largely know and can guess from the title of my blog, this is primarily a BSOD Debugging blog, and this will always be the primary aim of this blog. However, you as you already know I tend to post topics not directly related to debugging, and will post other topics which interest me like Theoretical Computer Science and Security.
I would like to make the following topics more abundant within my blog:
-Theoretical Computer Science
- System Security
- Windows Internals topics will be more tightly focused, which will be areas which you'll mostly need to know for debugging and security purposes.
- Debugging generally, for example looking at some of the common error messages.
I've chosen to write more things about Theoretical Computer Science, since it's something I would like to do as a career, especially the field of Quantum Computing, since it will combine my interest in Computer Science and Quantum Mechanics.
There's some great security tools which I would like to learn how to use more thoroughly, and these tools can reveal some detailed information about the operating system which isn't possible with other tools.
I'm also working on writing the Registry Internals blog posts, but I still need to get through the few papers I have on the subject.
If anyone has any other suggestions to what they would like to see more in my blog, then please say so.
I've decided to do two things with this blog post: show a Stop 0x133 and improve my DPC Internals post.
A Stop 0x133 is quite rare, and have seen it to occur more commonly on Windows 8.x and Windows Server 2012. It tends to be caused by a DPC Interrupt object causing a timeout and then leading to a bugcheck due to undefined system behavior. You'll also need a Kernel Memory Dump to be able to debug this type of bugcheck.
As you can see from the bugcheck description, the DPC has exceeded it's time allotment by one tick which is always the standard parameter for these types of bugchecks.
DPCs are Deferred Procedure Calls which will run at IRQL Level 2 or lower, and are used to defer I/O processing until a later time to avoid keeping the system at higher IRQL Levels. The DPCs can targeted at the current processor or a different target processor. Each DPC is stored within a queue which can be found within the PCR (Process Control Block).
The PCR base address is stored within the fs segment register on x86 systems, and the gs segment register on x64 systems. You can use the dg command to view the segment registers.
The Self field contains a 64 pointer to the flat address of the Processor Control Region. The field is called SelfPcr on older operating systems and stored at offset 0x1c.
The _KPRCB data strucutre contains a wealth of DPC related information, such as the Watchdog timer object, DPC Queue and the Timer Count and Limits.
The easiest method would be to use the !dpcs extension, and then view the DPC Queue.
The CPU field indicates the DPC Queue for the specified processor, the Type field indicates the type of the DPC and the _KDPC is the address of the DPC object data structure used to represent the DPC, with the Function field indicating the Deferred function to be called.
Each DPC is usually given a Medium priority by default, any Medium DPCs will be executed before Low priority DPCs, with Important DPCs have the highest priority. The DPCs are usually until IRQL Level 2, or the queue threshold for the number of DPCs is met.
On the other
hand, if a DPC is targeted at different CPU, and the currently waiting DPCs have high or medium
priority, then a Inter Processor Interrupt (IPI) is sent to the targeted
CPU to process it's DPC queue, although this can only occur if the CPU
is idle. The !ipi extension can be used to investigate the IPI state for a certain processor or the all the processors.
If the DPCs within the queue have low priority, and then the DPCs are queued until the threshold is met like before. All the DPCs
queued will be executed until the queue is empty, or a higher priority
interrupt occurs. Typically, the routine used for completing the DPC
queue is nt!KiRetireDpcList.
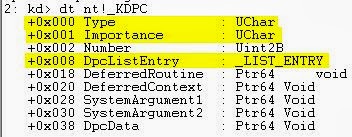
Now, let's investigate the _KDPC data structure, and examine some of it's fields.
There are three main types of DPCs: ISR DPCs, Custom DPCs and Threaded DPCs. This is what will be shown within the Type field.
ISR DPCs are used for handling I/O operations related to ISRs. The DPC will finish the I/O started by the ISR, remove the next IRP from the IRP Queue and then complete that IRP.
Custom DPCs have their own custom written routines or functions to handle, and Threaded DPCs which run at IRQL Level 0.
Threaded DPCs can't be preempted by any threads but will be preempted by a Normal DPC. Ordinary DPCs will stop the execution of all threads on that processor, and can stall execution of any threads on that processor for long periods of time leading to hangs, thus the reasoning for Watchdog timers.
The Importance is the priority levels discussed earlier, and the DpcListEntry is the doubly linked list for the DPC Queue.
There is one last important point to understand, and that is DPCs will run within their own stack, which can lead to complications if you wish to obtain the call stack of the thread rather than the DPC stack. If the system crashes within the DPC stack, then the default stack within the bugcheck will be the DPC stack and not the Kernel stack for the thread. I explained the types of stacks previously, but I would suggest reading Scott Noone's post here, to see how to obtain the address of the Kernel Stack from a DPC stack.
Now, that we have improved our understand of DPCs, we can investigate further into this bugcheck.
The problem starts with Remote NDIS USB driver, which was calling the CancelSendsTimerDpc.I believe that the driver uses a Custom DPC associated with a Timer object.
Looking at the code, it seems that the DPC may be looping itself by gathering a Spinlock at DPC Level, cancelling the Timer and then releasing the Spinlock again. The best method would be to check for any Windows Updates, or check for any third-party drivers which are related to Networking or Security Suites.
References:
Debugging Stop 0x133 - NT Debugging Blog
Windows Driver Kit Documentation
This is going to very loosely related to Programming and Computer Science I know, but I thought it was quite a interesting little simple programming project to do. I've written the code in C++, but you could easily adapt it to C or any other language if you so wish.
The Fibonacci Number Series is a special sequence of numbers which is the sum of the two numbers before the current number. All the numbers will be integers (whole numbers). There is a simple mathematical equation for expressing this relationship:
Our seed values, or starting numbers, are going to be 0 and 1. This can be seen with the variables shown in my code. The seed numbers have to be 0 and 1, or 1 and 1 in order for the above equation to work.
I've commented the code, so it should be easier to understand, even though it is a simple program, the components would only really make sense if you understood the Fibonacci Number Series.
The number of terms within the sequence can be selected by the user, and is then used to control the for loop for using the equation which I've named the Fibonacci Number Equation.
The main body of code comprises of a for loop and a if-else statement. I've applied the equation into the code on line 21. You can find lots of examples of this code on the Internet, but I thought I would comment the code to make it more user-friendly and give some general information about the number series, in which the other blog posts and tutorials seem to be lacking in.
The Fibonacci Number Series is also applied to Computer Science in terms of the Fibonacci Search algorithm and the Fibonacci Heap data structure.
The Fibonacci Number Series can also be found in Pascal's Triangle.
I'll most likely expand upon this topic in the future, and write a blog post about the applications in Computer Science. In the meantime, the next blog posts will be about exploring the Registry with WinDbg, and I might add a tutorial for Stop 0x133, but it's one of those bugchecks which is difficult without a Kernel Memory Dump.
Since learning to debug for the first time can be quite difficult at first, I thought I would write a short blog post as a method of motivation and encouragement for those aspiring to be Windows Debuggers. I've arranged the post in a few simple points.
Point #1 - Prior Knowledge Expectations
Have a clear understanding of computers in general. I'm not asking you to be a expert in a certain field (although it would be extremely helpful), but have a clear understanding of how computers work and how hardware interacts with the operating system at a entry level standard. You should understand the basics of drivers and system security.
Without any clear fundamental understanding of computers and Windows, you will certainly struggle to understand some of the more advanced topics. Some programming in C/C++ would be great benefit.
Point #2 - Knowledge
You don't have to know every single exact detail of how Windows works internally. Yes, you need to have a good understanding of how Windows works and which WinDbg commands and extensions are appropriate for each debugging situation, but I wouldn't expect someone (unless they have been debugging for a very long time at a professional level) to remember every exact tiny detail of the Windows operating system.
Sometimes, I won't remember every tiny detail but I will have a feeling in the back of my mind, that there is a certain register or certain data structure field which has some important information which could help me with debugging the problem. In these circumstances, I tend to check some documentation, ask another person or even check a previous blog post I wrote to see what bit within that Control Register enabled that certain feature.
Point #3 - Teamwork
I feel teamwork is a vital aspect of debugging and programming, and it enables us to overcome problems much more easily than if we chose to overcome the problem on own. Almost every forum I visited or contributed to, had a BSOD debugging team even if there wasn't a clear user title or badge to indicate that the members were part of a team of experts all thriving to accomplish the same goal. Solve the problem and use each others knowledge to teach and support each other.
There are some good examples I could give you. Let's start with one of my other interests which is Mathematics and Quantum Mechanics. All the great 20th Century Theoretical Physicists (much was uncertain about the subatomic world at the time) collaborated together and combined each others research and understanding together to understand how the subatomic world worked. Another example, myself and Patrick at Sysnative Forums always work with each other to solve BSOD problems and to share our knowledge and experiences. Our latest accomplishment was investigating the Stop 0x44 LogMeIn bug which has now been patched, and in process, have helped several users who depended upon the software.
How about Microsoft? Microsoft is a very large and one of the most successful companies in the world. Windows is a huge product, and each developer/debugger has expertise within a few particular areas of the operating system. Everyone works together to share knowledge and experience. Not everyone is going to know every area of the operating system internally.
Point #4 - Learning Takes Time
What is your personal motivation for learning to debug? We all have our reasons for learning how to do something new. Personally, I wanted to learn to debug because of the mystery surrounding BSODs and the small number of people which could solve such problems. I also really enjoy understanding how things work at a fundamental level. I feel debugging and Reverse Engineering combine some important skills, such as: Team Work, Problem Solving, Imagination and Analysis.
I tend to see some newcomers to BSOD Debugging, to give up far too easily and expect too much of themselves in too little time. Your not going to become a expert over night or reading a couple of Windows Internals books. It will take time to understand and learn the fundamental knowledge behind the subject. Remember that in the end, the rewards will be great and there nothing better than knowing that you accomplished something which you wanted to achieve.
Give yourself realistic expectations, speak to others who share the same interests as you, and have a go at looking into some problems yourself. You may be surprised about how much you do actually understand.
Point #5 - Building a Knowledge Repository
I've seen some people argue that you won't find any information on the Internet related directly to BSOD Debugging. I would disagree with that point. I have no I.T. Certificates\Qualifications or any Computer Science degree, and I have to managed to learn everything I know about computer from the Internet (online documentation, blogs, websites and forums) and various books.
The best book you could buy to get you started is the Windows Internals book. It's not too expensive, but you can get a good condition copy of the book used on eBay or Amazon. I managed to get a copy for £7.00 from Amazon with the fastest delivery option, and the book was is in very good condition.
I wouldn't rely on the entire book as your only resource, it's a excellent book and does teach you a great deal, however, even the authors suggest looking into other books and websites, if you wish to learn the exact specifics of how Windows works. This supports my point about the size and complexity of the Windows operating systems.
Build a repository of books, blogs, websites and papers for yourself, and then learn from these resources and use them as a reference point.
Personal Aspirations and Closing Points
I personally aspire to earn a PhD in Computer Science and solve some of the problems associated with the field. One of my personal heroes is Alan Turing due to his pivotal work during the WWII, and his theoretical work towards to the modern development of Computers and the field of Computer Science.
I'm a firm believer in free and open education for everyone, and that everyone can achieve their goals if they have the motivation and determination to get there. One of my other heroes is Arnold Schwarzenegger, and how he overcame everyone's' doubt about the realism of his own aspirations and goals.
Remember that we have our own strengths and weaknesses, and the sum is greater than the individual parts.
This is going to be mixture of programming and Windows Internals with some use of WinDbg, so it looks like it going to be Programming, Windows Internals and Debugging if we use the categories shown in my blog title. The idea of Thread Storage Slots is simple and therefore you should remember and understand it pretty quickly.
All threads running within a particular process address space are able to access all the memory addresses stored within that process address space. This in fact can cause some problems for some people, since some variables and classes are best to kept private to one specific thread. This brings in the concept and introduction of thread local storage slots.
All static and global variables can be accessed by all the threads within the same process address space, and will share the same fixed memory address in the global scope of the address space of the process. On the other hand, with locally defined variables these variables are local the stack of the thread, and will have differing memory addresses. The concept of thread local storage can be used to implement the advantage of global variable's fixed memory location, and then incorporate that into the benefit of having a variable which is private to that of a particular thread.
TLS is part of the C++ 11 Standard, and can also be used with the Win32 API. I'll demonstrate the Microsoft C++ version of this concept.
The __declspec(thread) is a C++ extension for indicating storage class specifiers. As you can see from the the above code example, the storage class specifier is notably the thread keyword, which indicates that the storage class specifier is a thread local storage type. We then create a variable called tls_i of a integer type and assign it to the value of 1. I took the variable name from the MSDN documentation for ease on my part, and to make the variable more self-explanatory later in the code.
Since this is a global variable, and will accessible to all parts of the program, you may expect that any writes to that variable will be shown in other parts of the code. However, this is not the case with this example as a result of the thread local storage concept. The tls_i variable is incremented by 1 in the Thread_Func function, but will still be 1 within the Main thread. This can be understood better when running the code.
Now, we understand how to write Thread Local Storage variables and data, let's examine how it implemented within Windows and where we can find this information within WinDbg.
The Thread Local Storage slots can be found within the TEB data structure.
At offset 0x02c, the ThreadLocalStoragePointer field is the linear address of the thread local storage array, the address can be accessed with the use of a pointer as known in the output above. Note that the TEB is stored within the FS segment register on x86, and the GS segment register on x64. The segment registers are primarily used for performance reasons.
The TlsSlots at offset 0xe10, shows the current number of TLS slots, the minimum number of slots is 64, thus the reason for the [64]. Each slot is indexed starting 0,
and is accessed with this index, this is implemented as a array with a
pointer to access each slot. The TlsLinks at offset 0xf10, is a doubly linked list of the TLS memory blocks for the process.
The !tls extension can be used to view the TLS' for a particular process.
The left column indicates the Index number, and the -1 parameter is used to dump all the TLS's for the currently running process. I believe the other column could possibly be the data. This extension is unfortunately sparsely documented.
Some further advantages of using thread local storage, is that it enables multiple threads to access the same variable without any locking overhead. Essentially, two threads could share the same memory address for that particular variable, and then each write their own private data to that variable. Furthermore, many platforms and operating systems support the use of Thread Local Storage, and therefore portability shouldn't be a problem.
The __declspec implementation only uses one large chunk of memory for a Thread Local Storage slot which is the sum of the size of each local thread variable. This enables the efficient use of indexing the slots. Internally, these variables are stored within the .tls section of the PE Header, which is part of the .rdata section of the PE Header. Please note the .tls section is actually not a requirement, and is mostly not used by most programs.
The TLS Directory Size indicates the size of the directory, which in turn describes to the loader how the local variables are going to be used by the thread.
We can view this further with CFF Explorer, and then check the TLS Directory.
The StartAddressOfRawData and the EndAddressOfRawData indicate the beginning and ending of the TLS section. The AddressOfIndex is the address of the index used to index into the TLS array of slots. The AddressOfCallbacks is a pointer into a array of TLS Callback addresses.
Going back to the ThreadLocalStoragePointer field mentioned earlier, this is the pointer which is used to differentiate between a variable being local to one thread and then local to another thread. The pointer is initialized with the _tls_index variable, and then given the offset of the threadedint variable so it points to local copy of the TLS type global variable created by the programmer. Note this is performed by the compiler and linker.
References:
__declspec (C++)
Thread Local Storage
Thread Local Storage (Windows)
Win32 Thread Information Block (TIB)
Thread Specific Storage for C/C++ (Paper)
Thread Local Storage Part 1 (5 Parts)
R4ndom's Tutorial #23: TLS Callbacks


.gif)