A very good post on Sysnative from muhahaa, illustrating the meanings behind the undocumented parameters seen in a Stop 0x1A, as result of a corrupt PTE.
Re: Need help with random BSOD's (Packard Bell EasyNote ML61)
I'm also planning on explaining all the registers, and their purposes, first part should be published tomorrow at some point.
Showing posts with label Stop 0x1A. Show all posts
Showing posts with label Stop 0x1A. Show all posts
Monday, 2 December 2013
Friday, 15 November 2013
Debugging Stop 0x1A - Working Set Free List Corrupt
Another simple memory management case to debug, I thought I explained working set beforehand, but it seems that isn't true so I'll also be explaining working set and the Working Set Manager.

The first parameter indicates the subtype of the bugcheck, in this case the 5003 corresponds to a corrupt working set free list which is usually a result of a hardware problem. The second parameter (undocumented) contains the address of the working set list for a given process.
Before, we go directly explaining the bugcheck, let's take a look at working set.
Working Set:
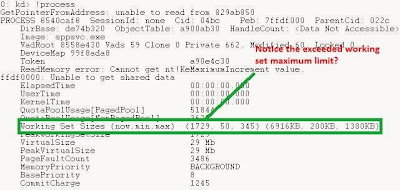
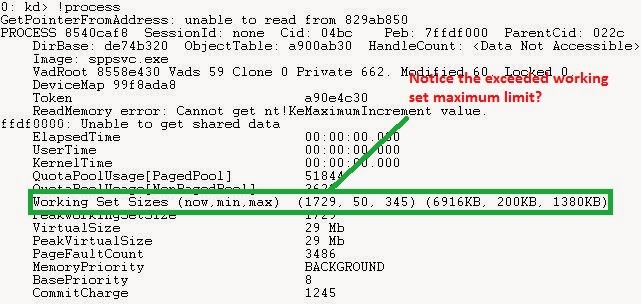
Working Set is simply a group of virtual pages allocated to a process which are present within physical memory (RAM). Windows by default sets the working set limits to a minimum of 50 pages and a maximum of 345 pages. However, these limits have little effect, since a process can exceed the maximum page limit as long as there is enough physical memory. The minimum and maximum working set can be set by the user with the SetProcessWorkingSetSize function. However, this isn't recommended by Microsoft and other developers, a few good threads can be found here and here.
The !process extension can give us the working set for a given process.

 The data structure applies to each individual page within a working set for a process.
It contains one field named Age, which is counter for when the Working Set Manager has incremented it's age value, because it hasn't been accessed. The counter's maximum is 7, and this is when a page is removed from the working set. The Working Set Manager is called by a system thread called the Balance Set Manager which waits upon two event objects. A event which is signaled upon a timer object is set to the signaled state every second, and a working set manager event which is signaled in certain memory conditions.
References:
Code Machine - _MMWSLE
The first parameter indicates the subtype of the bugcheck, in this case the 5003 corresponds to a corrupt working set free list which is usually a result of a hardware problem. The second parameter (undocumented) contains the address of the working set list for a given process.
Before, we go directly explaining the bugcheck, let's take a look at working set.
Working Set:
Working Set is simply a group of virtual pages allocated to a process which are present within physical memory (RAM). Windows by default sets the working set limits to a minimum of 50 pages and a maximum of 345 pages. However, these limits have little effect, since a process can exceed the maximum page limit as long as there is enough physical memory. The minimum and maximum working set can be set by the user with the SetProcessWorkingSetSize function. However, this isn't recommended by Microsoft and other developers, a few good threads can be found here and here.
The !process extension can give us the working set for a given process.
These working set limits are still governed by the hard working set limits set by Windows. On x86 systems it's 2,047.9MB and on x64 systems it's 8,192GB.
So, when a process causes a page fault, the Memory Manager adds more pages to the working set. However, there may be times when the system begins to become low on memory, and therefore instead of adding pages, pages are replaced.
Although, there may be times, when the physical memory drops to a certain level, that the Working Set Manager must intervene and start scanning through each process' working set, in order to free some memory. This is known as trimming. You can run working set trimming on your own processes with SetProcessWorkingSetSizeEx.
Generally, the Working Set Manager will look at processes which are above their working set minimums, and then checks the Accessed protection bit in the PTE for that virtual page (use !pte), if the process has been accessed then (the bit is clear), then the page is said to be aged. If the page still hasn't been accessed on it's second run, then the page is freed from the working set of the process. Otherwise, the process repeats itself.
On the other hand, if the Accessed bit has been set, then it is cleared by the Working Set Manager. The Working Set Manager then scans the page again (if needed) on it's second run, and checks if the page has been accessed again. If the page hasn't been accessed again, then the page is aged too, and liable to be removed from the working set.
We can view the entries of the working set for a process with the !wsle extension.
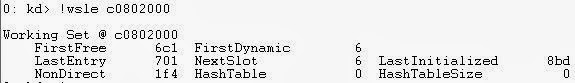
The parameters and bit flags associated with this extension are all documented withing WinDbg. As you can see, we can only gather very basic information at the moment, this the Working Set Free List is corrupt. This can be further seen with the dt nt!_MMWSLE command.
It contains one field named Age, which is counter for when the Working Set Manager has incremented it's age value, because it hasn't been accessed. The counter's maximum is 7, and this is when a page is removed from the working set. The Working Set Manager is called by a system thread called the Balance Set Manager which waits upon two event objects. A event which is signaled upon a timer object is set to the signaled state every second, and a working set manager event which is signaled in certain memory conditions.
References:
Code Machine - _MMWSLE
Monday, 9 September 2013
Debugging Stop 0x1A - Corrupt Image Relocation Table
This blog is most likely, going to be more of me attempting to explain relocation and the relocation fix up table.

The first parameter indicates that image relocation fix-up table has become corrupt, the image relocation table is a table of pointers for a program, which are used to assign memory addresses to parts of the program. Each pointer is called a fix-up. Pointers are basically used in programming, to assign or use memory addresses in programs.
The MSDN documentation points out, that this issue is more hardware related, and therefore the only valid reasons I could think of are - corrupt memory addresses are being assigned or maybe the MMU wasn't translating virtual pages to physical pages, resulting in invalid memory addresses.
Thursday, 22 August 2013
Debugging Stop 0x1A - Out of Sync PFNs and Page Tables
I've seen this bugcheck and it's parameter 403, becoming more common recently, and therefore thought I would share how I go around debugging the problem.
 Stop 0x1As rarely tell us what the parameters actually indicate and substitute to, therefore we need to check some documentation provided by Microsoft on their WDK (Windows Driver Kit) on MSDN. Stop 0x1A Documentation - Bug Check 0x1A: MEMORY_MANAGEMENT
The above is the meaning for the first parameter of 403, remember to always check the first parameter, the other parameters are usually meaningless unless you probably work for Microsoft. So, in this example, we need to examine the binary representation of the two parameters and then compare their bits.
We can use the .formats command to examine and compare the two parameters together like so:
 The parameters differ greatly, and thus leads me to believe this is more of a software related issue. To support my point further, using the !thread extension I was able to find a pending IRP for the crashed thread, although, since this is a Minidump and not a Kernel Memory dump, I'm not able to use the !irp extension and view the stack for the IRP.

I've requested the use of Driver Verifier for the user. In an idea world, I would have had a Kernel Memory dump and checked the IRP.
Side Note: I hope this article helps anyone, and I do try to update my blog as much as possible, but it may be only a few blog posts a month since I attempt to find good debugging examples and write blog posts with examples to support concepts e.g. Working Set Internals

"The page table and PFNs are out of sync . This is probably a hardware error, especially if parameters 3 & 4 differ by only a single bit."
The above is the meaning for the first parameter of 403, remember to always check the first parameter, the other parameters are usually meaningless unless you probably work for Microsoft. So, in this example, we need to examine the binary representation of the two parameters and then compare their bits.
We can use the .formats command to examine and compare the two parameters together like so:


I've requested the use of Driver Verifier for the user. In an idea world, I would have had a Kernel Memory dump and checked the IRP.
Side Note: I hope this article helps anyone, and I do try to update my blog as much as possible, but it may be only a few blog posts a month since I attempt to find good debugging examples and write blog posts with examples to support concepts e.g. Working Set Internals
Monday, 8 July 2013
Debugging Stop 0x1A - MEMORY_MANAGEMENT
Thanks muhahaa for pointing the PFN data structure out to me.
A Stop 0x1A is quite common in my opinion, and usually is caused by two things: device drivers and RAM. Although, other causes can include the Windows Kernel and memory located in other areas.

Firstly, looking at the parameters presented to us by WinDbg, we can see that the first parameter usually indicates the type of memory management violation which has occurred.
From this example, 41790 indicates that a page table page has become corrupt. The page table is used to store mappings between physical and virtual memory addresses.
We can see from the call stack for the thread, that some virtual memory related routines were being called by the Windows Kernel, for instance the nt!NtUnmapViewOfSection is used to view the unmap the view (mapping of a section object in virtual memory for a process) from the virtual memory address space for a process.

The interesting thing about this dump file is the third parameter, which is 0xffff, this is very similar value when a device driver has called MmUnlockPages too many times on a MDL, which causes the reference count for the number of PFN entries to drop below zero.
We can view the data structure for a PFN database and check the reference count:

We can see that the number of Used Page Table Entries reference count has dropped below zero, here my suggestion would be to use Driver Verifier along with the Special Pool option.
Subscribe to:
Posts (Atom)