Saturday, 12 July 2014

WinDbg Power Policy Extensions - !podev, !popolicy, !poreqlist, !pocaps, !poaction

The !podev, !poreqlist and !poaction aren't documented within WinDbg for some reason, but there is a person which has written about them thankfully. These extensions are a must for Stop 0x0A and debugging any issues related to power like Stop 0x9F.

!popolicy 

The !popolicy displays information related to the current power policy of the current user. 


!pocaps

The !pocaps extensions displays information in relation to the power capabilities of the system, this is ideal for checking if drivers are attempting to use a unsupported sleep state.

!poreqlist

The !poreqlist extension will list all outstanding power IRPs from any driver which has called the PoRequestPowerIrp function. The function will create a Power IRP and then send it to the top of the device stack for a given device object.

 The list of power IRPs will be shown under the FieldOffset field. The extension will provide the device object, driver object and the nature of the power IRP.

!poaction 

The !poaction extension will provide the current power action, and a list of devices which are currently being powered off or down. It also provides a list of completed IRPs. !poaction may require a Live Debugging session, but I'm not sure on this due to the lack of documentation.


!podev

The !podev will provide power related information for a PnP device object.


References:

Debugger commands (!drvobj, !devobj, !podev, !devstack) that make my life easier (part 1)
 
Debugger Commands (!poaction, !poreqlist) that make my life easier (part 2)

Thursday, 3 July 2014

Mathematics for Theorectical Computer Science

I thought I would create a list of Maths topics which were relevant for those who are wishing to study Computer Science. I've seen most people on online communities referring to topics which have very little relevance or completely pointless in relation to Computer Science. This list is based upon my experiences and a friend who studies Computer Science at University. I've listed the most popular Computer Science fields and their Maths topics below.

General Computer Science:

These are the topics which you will typically study in your first year, and therefore will have to do.
  • Graph Theory
  • Linear Algebra (Matrices and Vectors)
  • Calculus I and maybe some Calculus II
  •  Analytical Geometry
  • Set Theory
  • Big O Notation
  • Radicals, Logarithms and Polynomials
  • Logic
Computer Graphics: 

I'm not too sure about Graphics, but these are the subjects which do have some relevance.
  • Fractal Geometry
  • Linear Algebra
  • Analytical Geometry
  • Differentiable Geometry
  • Hyperbolic Geometry
  • Differential Equations
  • Functional Analysis
Information Theory:
  • Differential Equations
  • Real and Complex Analysis - Fourier Series
  • Calculus II and Calculus III - Taylor Series
  • Probability Theory
Algorithms and Data Structures:

Most algorithms are used to solve mathematical problems, rather than the algorithms you see in commercial programs.
  • Graph Theory
  • Number Theory
  • Combinatorics
  • Probability Theory
  • Big O Notation
  • Set Theory
Cryptography and Computational Number Theory: 
  • Number Theory

Computability Theory, Computational Complexity Theory and Automata Theory:

  •  Logic
  • Set Theory
  • Calculus I
  • Recursion
  • Proof Writing Techniques
  • Number Theory
  • Big O Notation 
  • Probability Theory
In general, it's best to study Discrete Mathematics rather than Continuous Mathematics. There's some fields like Abstract Algebra which are used in Algebraic Coding Theory. Furthermore, Discrete Geometry has its applications too. Continuous Mathematics encompasses areas like Calculus/Analysis and Topology etc.


WinDbg Extensions - !tz and !tzinfo

When I was writing up my WinDbg cheat sheet, I managed to stumble upon the !tz and !tzinfo extensions in the WinDbg Help documentation. The extensions seem to be solemnly documented directly by Microsoft, but using the ACPI documentation is easily to understand what most of the fields mean.

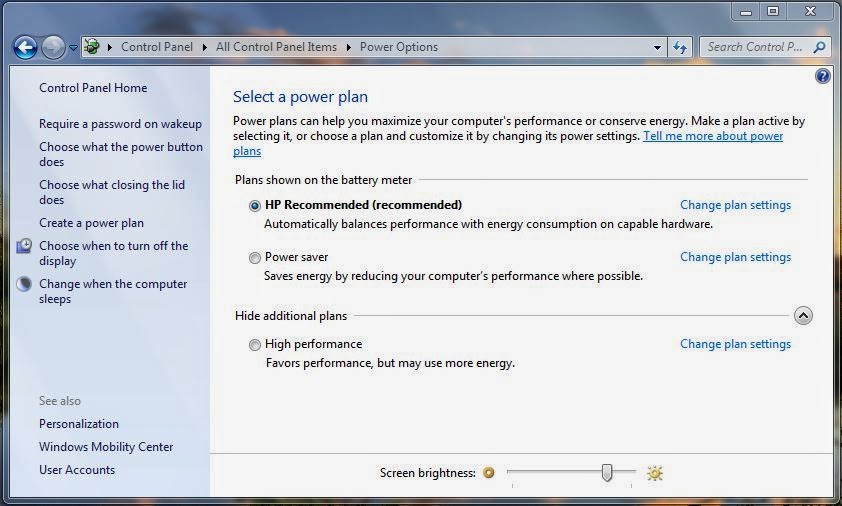
The !tz and !tzinfo gather information from the ACPI subsystem about the currently allocated thermal zones and the cooling policies being implemented. On Windows, you can manipulate the cooling policies slightly by changing your Power Settings.

Power Settings - Windows 7
 
By changing the power consumption, the Active and Passive Cooling policies will be changed. I will explain the difference between Active and Passive cooling later.

The Thermal Management mostly uses a component called the OSPM (Operating System Directed Configuration and Power Management) to manage different cooling policies and check the thermal zones.

The OSPM is used to remove any device management responsibilities from the legacy devices, and therefore made thermal management more robust.

The OSPM creates logical regions called Thermal Zones. Thermal Zones are a key component within Thermal Management. The entire motherboard is one thermal zone, and is usually subdivided further into smaller thermal zones to make management more efficient. A cooling policy is set for each individual device with a thermal zone, and therefore each thermal zone will have multiple cooling policies and cooling resources (e.g. fans). An example of a thermal zone is below:


We can find the Thermal Zones on a system using the !tz extension in WinDbg.

The most useful part of the !tz output is the Thermal Info Address which we can use with the !tzinfo extension to give the trip point temperatures of the thermal zone(s).

These trip point temperatures correspond to the cooling policies implemented when that threshold is reached. Each device within a thermal zone will have its own threshold. The two main cooling modes are Active Cooling and Passive Cooling.

Passive Cooling - The operating system will decrease the power consumption of all devices, in order to reduce the temperature of the system, however, the cost is a reduction in system performance.

Active Cooling - The operating system will increase the power consumption of cooling resources such as fans, to decrease the temperature of the system. Active Cooling has better system performance, but with laptops it will reduce the battery life much faster than usual.

There is also a Critical temperature threshold, whereby if any thermal zone breaches this threshold, then the entire system will shut down. The thresholds are managed by objects called Thermal Objects. 

The _TMP object is the current temperature of a thermal zone, and is compared to the _HOT, _CRT, PSV and _AC0/_AC1 thermal objects in order to implement the different cooling policies. The thermal object thresholds can be seen in the diagram below:


If the _TMP object value reaches the _CRT (Critical Temperature Threshold), the entire system will shut down. If the _TMP reaches the _HOT value, then the system will be placed into the S4 sleep state (Hibernation) if this mode is supported. 

If the _TMP object reaches the _AC0/_AC1 (Active Cooling) then the Active Cooling policy will be implemented; there is two versions which adjust the fan speed. If the _TMP object reaches the _PSV (Passive Cooling) then the Passive Cooling policy is used. The Thermal Events are notified to the OSPM by Thermal Change Notifications.

We can check which power states are supported by using the !pocaps extension:

The power states are stored within an enumeration called _SYSTEM_POWER_STATE.

Additional Reading:

Thermal Management 

 System Power States (Windows)


Wednesday, 2 July 2014

Using !kuser to find _KUSER_SHARED_DATA

The _KUSER_SHARED_DATA structure contains some interesting information related to the currently logged on user, we can obtain the address of this data structure by using the !kuser extension in WinDbg. Most of the fields aren't officially documented from what I can find, but you should be easily be able to work out what they mean from their names.


Using the address with the _KUSER_SHARED_DATA will provide the following (omitted structure):


There is some debugging bit fields within this structure, so you can check what debugging features have been enabled for that user. It also contains some basic system information.

Additional Reading:

The System Call Dispatcher on x86

struct KUSER_SHARED_DATA


Friday, 27 June 2014

WinDbg Cheat Sheet

I've created a comprehensive and complete WinDbg cheat sheet of the most general and useful extensions/commands which you'll be using regularly. I've added a few data structures to the list too. The list is organised by category, according to the different areas of debugging such as Memory or I/O.

Download Link (OneDrive) - https://onedrive.live.com/?cid=7101A9E8FE03DB78&id=7101A9E8FE03DB78!105
  
If there are any suggestions or corrections to be made, then please leave a comment in the comments section. Additionally, I've been attempting to convert my blog posts into a .DOC format which can be printed, unfortunately I haven't added any images to conserve space and ink. However, I have tried to construct the blog posts so you know which row or column to check; dd commands with the IAT/EAT post for example.

Wednesday, 18 June 2014

List of Reverse Engineering and Debugging Tools

I may have created a small list of tools before, however, I would like to expand this list and provide some better descriptions for each of the tools listed. These tools are either completely free or have a limited free version which provides enough functionality for those like myself, who aren't professional security researchers, escalation engineers or get paid for doing reverse engineering/debugging. These tools can and are used by professionals and enthusiasts alike. If you have any recommendations then please add a link to the comments section.

WinDbg - Reverse Engineering/Debugging

This tool is my most favorite, it provides complete functionality for enthusiasts and is for free. There is a wide range of extension and commands for viewing data structures, memory addresses and call stacks. It can be used for both reverse engineering and debugging BSODs (Blue Screens of Death).

There is good documentation for WinDbg for finding hidden rootkits, examining data structures and looking at raw memory. Most of this information has been used in my blog for writing tutorials and adding my own information to. It can be used for static analysis and real-time analysis.

Link - Windows Driver Kit (WDK) and Debugging Tools for Windows (WinDbg)

OllyDbg - Reverse Engineering (User-Mode)

OllyDbg is a great tool for reverse engineering user-mode programs. This is a another standard tool if you wish to examine malware or would like to learn the PE structure. This tool is for free, and again is there is great documentation for learning how to use it. Please check the Blogroll section for such blogs.

The data structure being viewed is the _PEB data structure, which is stored at offset 0x30 in the FS register for x86 systems. It is primarily used for static analysis.

 Link - OllyDbg v.1.10


IDA Pro - Free Version

 This tool is used for reverse engineering, and widely used by professionals to my knowledge. This is a very powerful tool, and be used to examine libraries in the IAT and EAT, look at strings stored in memory and assembly instructions. There are tutorials available on their website.


Link - IDA: About


Analyze It!

This tool is great for displaying information about a specific binary file (static analysis).


I could only find the program hosted on Softpedia, but I'm sure that there wasn't any other programs bundled with the installation package.

Link - Analyze It! Free Download (Softpedia)


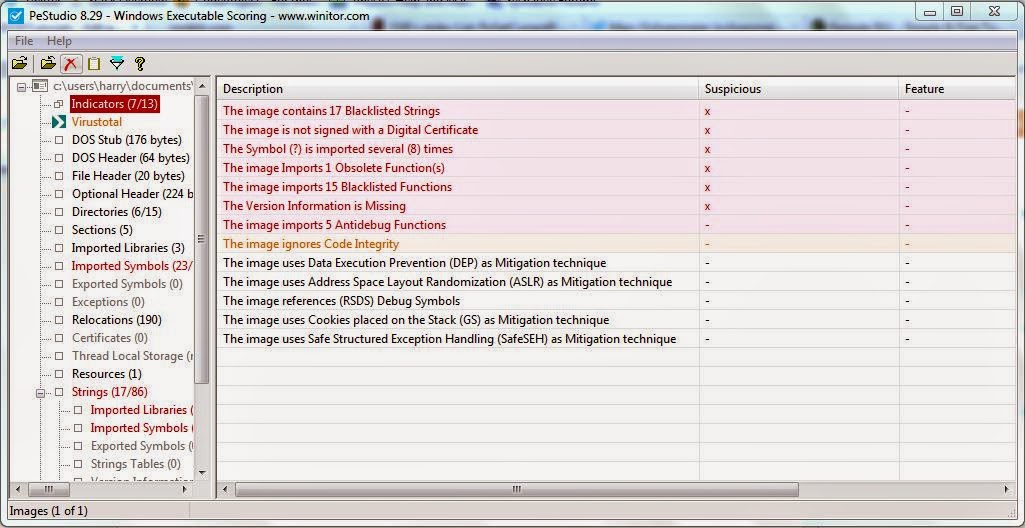
PeStudio

This is tool provides the same features as the other program, but with a simpler and cleaner UI and is easier to use in my opinion. It also has VirusTotal integration.


Link - PeStudio

Twitter - @ochsenmeier (Developer + Updates)

Hook Analyzer

The program enables you to hook to a certain active process, and then pull information from that process. It only works with Ring 3 (User-Mode) processes to my knowledge.
 

PE Bear

PE Bear is another static analysis tool for examining PE files, you can view file signatures and view packers which have been used.

 Link -PE Bear Blog

WinHex 

WinHex can be used for examining the hexadecimal format of files.


Process Explorer

Process Explorer is a Microsoft produced tool, which can be used for finding general information about active processes. It has Virus Total integration.

Sunday, 15 June 2014

Computational Number Theory - Pseudo Random Numbers

Computers are increasingly being used to solve mathematical problems, and are becoming more prominent in solving problems in Number Theory and Graph Theory, as well as, fields of Physics and Biology. However, computers have been used to create seemingly random numbers for either games or security purposes; these seemingly random numbers are called Pseudo-Random. They may seem random but in fact they aren't random at all.

To illustrate the difference between a true random number and a pseudo random number, look a look at the two images I've taken from Bo Allen's blog:

True Random Number
Pseudo Random Number
The difference is very obvious and thus highlights the key differences between a true random generator and a pseudo random number generator. A pseudo random number generator uses a mathematical algorithm, which is able to produce seemingly random numbers. A true random number generator uses methods which can't be predicted, and therefore are truly random. The randomness of numbers is important for encryption purposes and cryptography. 

The true random number generators are hardware based, and most use the physics of Quantum Mechanics and it's probabilistic nature, like the quantization of electromagnetism which lead to discovery of photons and the Photoelectric effect. A pseudo random generator uses a software based mathematical algorithm to generate these random numbers.

A list of random number generators can be found here.