Sunday, 12 January 2014

Debugging Stop 0xC4 - DDI Compliance Rules

Driver Verifier in Windows 8/8.1 has added more new debugging and testing procedures, the example in this blog post is going to be about DDI Compliance Rules, and how to debug such a bugcheck. I know this is a very easy bugcheck, but I just wanted to explain some of the parameters and the extensions we can use with it.

The first parameter contains the identifier for the broken DDI Compliance Rule, and the second parameter contains the pointer to the string which describes the broken DDI Compliance Rule.

We should discuss what are DDI Compliance Rules and what is DDI Compliance Checking. DDI Compliance Rules define how a driver and the Kernel Mode side of the operating system should interact, in order to prevent any crashes or problems. The DDI Compliance Rules apply to  WDM, KMDF, NDIS and Storport drivers. In this example, since driver has broken a Windows Driver Model framework DDI (Driver Device Interface) rule, we'll look at the WDM side of things.

The DDI Compliance Checking Driver Verifier option is therefore used to check that these drivers are complying to the the DDI Rules. The exact type of rules which are checked, are related to function calls at IRQL Levels and the acquisition and release of synchronization dispatcher objects like Spinlocks.

We can use the !ruleinfo extension with the first parameter to gather information about the broken DDI rule. The !ruleinfo extension can be applied to the third parameter and fourth parameter to gather further information, although, this isn't applicable for this particular example.


We can see that the rule is named IrqlObPassive, just from reading that one word, you should be able to gather that the rule is related to an Object and a IRQL Level of Passive. The full details tell us that ObReferenceObjectByHandle function should only be called when the processor is executing at IRQL Level 0.

The ObReferenceObjectByHandle function is used to check the access permissions for creating a handle to a object, if the access permission are fine, then the handle value will be returned and added to the handle table of the appropriate process. A pointer will also be returned to the object's body.

 The same rule information can be found using the dc command with the pointer to the string.


We can see that the function call was called at the wrong IRQL Level. 


Looking at the call stack with the knL command, we can this the driver which potentially causing the problem.


The driver in question is called pnpnptool.sys, and is related to a Quest software program.

References:

DDI Compliance Rules (WDM)
DDI Compliance Rules
IrqlObPassive rule (WDM)
!ruleinfo (Windows Debuggers)
ObReferenceObjectByHandle


Saturday, 11 January 2014

Debugging Stop 0x1E - Finding the Exception Record Address in the Stack

This is going to be a very short blog post, just to demonstrate how to find the Exception Record address in the stack, and how many times it seems to appear within the call stack. Interestingly, but not unsurprisingly, the exception code wasn't passed to any of the exception handlers in the call stack.

The blue highlighting is the address of the exception record, and the green highlighting is the address of the trap frame which contains the last saved context.

The !exchain extension shows all the exception handlers in the call stack.

The _CONTEXT data structure can show us the saved registers from the trap frame. Please note I've omitted this data structure to the main registers.


Internals of Direct Memory Access Part 1

Introduction 

I've briefly explained Direct Memory Access, and then applied it specifically to Windows and graphics cards, however, this blog post will take a look at the general aspect of Direct Memory Access and how it works.

Direct Memory Access (DMA) enables devices to be able to directly access and transfer data between the device's bus or own memory and RAM within the need of interrupting the CPU, and using the CPU to complete such operations. Traditionally, without the use of DMA, the CPU would use PIO (Programmed I/O) and be fully occupied with this operation for the duration of the read or write transfer operation. DMA removes this, and enables the CPU to complete other tasks. Although, the CPU still has to initiate the transfer, and will receive a interrupt to show that DMA transfer has completed.

Typically, there are two types of DMA implementations: ISA and PCI. These two implementations work differently from each other, with PCI using the concept of Bus Mastering or first-party DMA, and ISA using a DMA controller resulting in the concept of third-party DMA.

ISA DMA Internals

I'll start firstly with concept of the DMA controller, even though it's pretty much obsolete, and is only used on motherboards with old ISA buses. I will not speak much about the old version of Direct Memory Controller, since it's a old technology and most likely will never debug a system using this.

The DMA Controller is called the ISA Direct Memory Access Controller or DMAC. The DMAC connects the devices to Channels. Each Channel consists of two parts: DMA Acknowledge (DACK) and DRQ (DMA Request).

Simplified DMA Controller Diagram
With the DMAC, there is currently 8 different channels, with the method of connecting two different DMACs together, to create a Master and Slave configuration. Each Channel was assigned to a different device, with some being created for a specific device, like Channel 2 being used for the FDC (Floppy Disk Controller).

Channel 0: Reserved for system use.
Channel 1: Available
Channel 2: Floppy Disk Controller
Channel 3: Hard Disk Controller
Channel 4: Slave DMAC input to Master DMAC
Channel 5: Available
Channel 6: Available
Channel 7: Available

The Channels which are marked Available can be used for any device. Due to the limitations of the DMAC, the above Channels would used by two DMACs like in the diagram below.

The HOLD (Hold Acknowledge) and HLDA pins are used to take control of the ISA bus for DMA transfers. The HOLD pin is signaled by the Master DMAC to request control, and the HLDA pin is signaled by the processor to acknowledge and accept this request.

You may notice the TC (Terminal Count line) and a OR gate. The result of the OR Gate depends upon the condition sent by the Master DMAC and the Slave DMAC. The TC line will be raised, when the transfer request sent to the DMAC has been completed. Using the knowledge about Truth Tables, two truths (two 1's) will output a truth or 1.

There is some important aspects to remember with DMA on ISA implementations. DMA can only access physical memory addresses, and therefore will never to be able to access virtual memory addresses. Furthermore, the Master DMAC can access 16-bits, whereas, the Slave DMAC can access 8-bits for transfers. DMAC0 is the Slave and DMAC1 is the Master. All registers are 16-bits.

Port Mapping and Registers


With operating system kernel development, these generic registers are usually defined with a enumeration for easier readability when writing the code.These registers are used to set certain settings for the DMA Controllers, such as clearing the flip flop register to it's original state, this is important for when your doing 16-bit transfers on the Slave DMAC.

The Channel Ports use Port-Mapped I/O which separates a device address space from memory, each port is used to access a certain device. To use these ports, you would need to use the Intel In (Input from Port) and Out (Output from Port) instructions.

Each Channel Port is separated into a base address and a counter. The base address is used to find the location in memory where to read or write to, and the counter is used to show much is being transferred on that channel. 

Please note that I haven't shown all the registers, and will provide references if your interested.

Operation Modes

Operation Modes are used to define how data will be transferred using DMA, the three types of operation are: Burst Mode, Cycle Stealing Mode and Transparent Mode.

Burst Mode: Data is transferred in one complete contiguous sequence, which causes the CPU to become inactive until the DMAC transfers control back to the CPU. The control is transferred using Bus Request (BR) and Bus Grant (BG) signals.

Cycle Stealing Mode:  The DMAC transfers one byte at a time and transfers control back to the CPU, this process is continously repeated with BG and BR signals until the data transfer is complete. This is used to stop the CPU from being completely idle, which can comprise system performance since nothing can executed by the CPU.

Transparent Mode: The DMAC only transfers data when the CPU is idle in terms of not executing any instructions related to any buses. The DMAC will need to work out when the CPU is idle which can be complicated.

References:

Direct Memory Access
Operating System Development - Broken Thorn
ISA DMA - OS Dev
I/O Ports - OS Dev
DMA Controller 8237

The second part of this blog post will take a look at the PCI DMA and the concept of first-party DMA. Again, you can find more information in the References section, I chose not to explain all of ISA DMA since it's a old and almost obsolete technology which only used in old Windows systems.

Friday, 10 January 2014

Debugging Stop 0xA5 - ACPI_BIOS_ERROR

To begin this is the first time I've personally seen this bugcheck, however, Patrick (@bsodanalysis) has beeen noticing this bugchecks occur on the HP Envy 700-074 model with Windows 8/Windows 8.1. The best resource you could use with this bugcheck is downloading yourself a copy of the ACPI Specification and then reading through the relevant parts of the documentation. Operating Regions should be located on Page 33, but I will explaining those in this blog post anyhow.

The most important part is the first parameter, which indicates the exact problem which has happened, this is partly due to poor ASL (ACPI Source Language) code used by the vendor, which is then complied into bytecode called AML (ACPI Machine Language). The only method to fix this problem is to search for a later version of the BIOS.

We can gather some BIOS information using the !sysinfo machineid and !sysinfo smbios extensions.

This information can used to the vendor which BIOS version this problem is happening with, and where they need to debug their code.

Using the above information, we know why the system crashed and what component caused it, and we have gathered some system information which we can provide to the vendor. Let's investigate further into the concept of address spaces at ACPI Level and how they relate to Operation Regions.

Address Spaces are used to access hardware which isn't within the scope of the ASL code, these include the CMOS and RAM. A operation region is used to provide access and create a form of scope into the address space. The programmer who is writing the ASL code will provide boundaries to these operating regions, such as the range of the address space to be accessed.

These address spaces can then be defined with a field, which is later used by AML Interpreter to create a address which can be passed to the Address Space Handler to access a physical address. The address is created from the field's address and the operation region's address offset. Each address space is said to belong to a certain device, and any references within that device's address space will be handled by the device's Address Space Handlers. Each Address Space Handler will need to created with the device's namespace object to conform with the scoping rules.

With this bugcheck, the BIOS will define which operation regions and address spaces the operating system is available to access and use, however, if these operation regions were changed to be used by a particular device, and the operating system accesses these regions, then the system will bugcheck.

Furthermore, as a side note, each operating region will need to register a operating region handler to the ACPI driver using the RegisterOpRegionHandler function. By registering the handler, the ACPI device can transfer data to the ACPI device's function driver. However, the ACPI_OPREGION_ACCESS_AS_COOKED access type must be specified to enable the transfer of information.

Debugging Tools:

WinDbg does support ACPI debugging, but only if you have a checked build of Windows or a checked ACPI.sys driver, which you can obtain separately. More Information - ACPI Debugging 

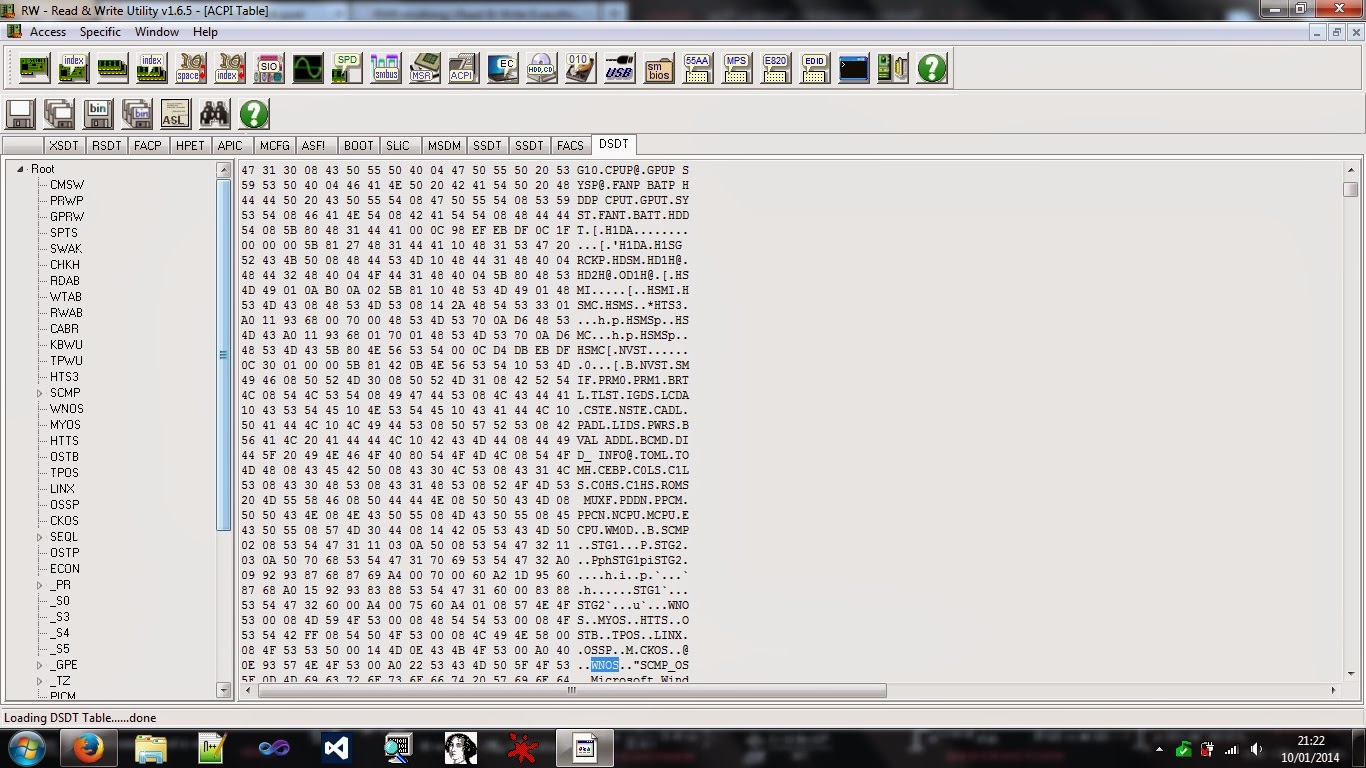
On the other hand, I have managed to find a freeware tool called RWEverything, which is designed for Windows operating systems, and will give similar information to the WinDbg extensions.


References:

Accessing a Operation Region

RegisterOpRegionHandler

ACPI Specification - Operation Regions


Wednesday, 8 January 2014

Shadow SSDT Hooking with Windbg

The Shadow System Service Dispatch Table can be hooked into much like the IDT and the SSDT. The SSDT for the Windows Kernel, and the Shadow SSDT is designed for the Windows subsystem (win32k.sys). The SSDT and the Shadow SSDT both use the SST (System Service Table) data structure, which is part of a another data structure called the SDT (Service Descriptor Table).


The System Service Table takes the following format as a data structure:


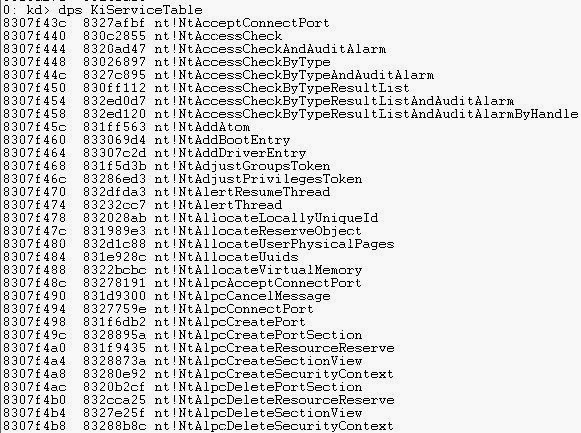
The SSDT as said before, is a array of function pointers to important system service routines. This true for the Shadow SSDT too. We can view these two tables in WinDbg, using the dps command and the name of the associated table.


Here's the Service Table used by the System Service Dispatch Table, this the array of function pointers to kernel routines.

Again, we can check the Shadow System Service Dispatch Table, and gather similar information. You can see the routines are all related to the Graphics Device Interface (GDI).

The Argument Table is the System Service Parameter Table (SSPT), which is used to hold all the arguments for the routines within the dispatch tables. In fact, as a side note, with OOP languages like C++, you can create a dispatch table or the compiler will create a Virtual Function Table if you create class objects which use Virtual Functions. Each virtual function call is dispatched through the vTable.

Threads contain a pointer to either the System Service Table data structure or the Shadow System Service Table data structures, depending if they require the graphics routines to be called. Using the _KTHREAD data structure we can find the pointer to the table.


You can use the !for_each_thread extension with a .echo command to print ServiceTable field of the _KTHREAD data structure for the active threads running on the system. Suspicious threads will contain unknown tables. This is a normal thread:


Use the dps command on any strange table, and then use the dds with the entries to find more information. Here's an example from my normal thread:


The dds command dumps referenced memory with symbols, whereas, the dps command dumps pointers with symbol information. All the WinDbg command are fully documented within the WinDbg help section.

Another method is to check mismatched memory ranges in loaded modules, using the !chkimg extension with the -d parameter. This parameter searches the module address ranges for any mismatched regions, and then dumps these with the number of bytes, and the expected and found range.

I've taken a example from the WinDbg documentation, and will explain each part of the output.


The yellow highlighting shows the address range: start and end. The underling of the 2 bytes indicates the size of range, with the module name and function name with offset to start of the range. The brackets indicate the number of bytes since the last error.

The second line used with the red box, shows the expected byte values and then the found byte values associated with the image. The address range was greater than 8 bytes, then the byte values may be omitted to the first 8 bytes.

You can even use the !for_each_module extension with the !chkimg extension to use the extension on very loaded module in the system. The following format is used:

!for_each_module !chkimg @#ModuleName 

References:

System Service Dispatch Table

Shadow SSDT Hook

Hooking Shadow SSDT on Windows 7


Monday, 6 January 2014

Debugging Heaps and Heap Internals Part 2

Heap Segments

Heap Segments refer to the Heap Segment of a program, much like when you have a Code Segment and a Data Segment, there is a Heap Segment which is for the Heap.


 Our heap blocks live within this heap segment. Each heap segment belongs to a certain running process. We can use the !heap -stat extension in WinDbg to gather more information about each segment.

The !heap -m extension will show us information about all the segment entries within the heap.

Debugging the Heap

We can use the !address -summary extension to gather a summary of what is consuming the address space of the process, and then check for any heap exhaustion.

Busy refers to the number of allocated heap blocks, let's examine further with the !heap -s extension, whilst omitting the address of the heap. This will give us general information about all the heaps within the process address space. Note, that the heap example I have been using, is the default process heap.

Using the s command with some parameters, we can search through the specified heap, and hopefully find some modules. We can then use the ln command with address of modules to find which .DLL or process is consuming all the heap memory.

The important part is the L? syntax which disables WinDbg's address range limit of 256MB. The -q specifies that we're searching for Quad Words (64-bits), we can change it to -d.

The other option is to use Global Flags, and then set the debugging features for a process.

Heap Tail Checking - Each heap block will be assigned with a signature, if a buffer overrun occurs and then damaged this signature, then the heap will report this error.


Heap Free Checking - Each freed heap block will be stored on the heap free list, each free block will then be filled with a certain pattern, and see pattern will be checked to see if there are any changes within the pattern. For example, process continuing to write data to that block when it's free.

Heap Parameter Checking - Checks parameters passed to any heap function calls.

Heap Validation - The heap is validated at each heap function call, and checks if it's still within a consistent state.

Additionally, if your going to use the HeapValidate function call, then ensure the _HEAP_ENTRY_BUSY flag has been set for that heap entry. We can view this in WinDbg with the !heap -i extension. You must set the context of the heap first.


Heap Tagging - Supports the specification of tags for heap allocations.

Page Heap

The next important debugging feature is the page heap. Page Heap is primarily used for detecting heap corruption, whereby a process writes upon it's allocation and thus corrupts the data within the heap. It can also occur as a result of a process writing to a free heap block.

Page Heap is managed by the Page Heap Manager, and there are Page Heap debugging features it provides: Full Page and Normal Page.

Normal Page Heap works by applying a pattern when the allocation has been freed. The pattern will be disrupted because of buffer overflows and writes to free blocks.

The Full Page Heap works differently, and should be used with caution, each allocation is given it's own page and adds a guard page at the end of allocation. This will produce a access violation, and the exact line of code which caused the error. This information can be gathered along with a stack trace using the dds command and the DPH_BLOCK_INFORMATION data structure.

You will need to apply the dds command to the StackTrace field.

You can debug for memory leaks in the heap with !heap -l extension.

References:

The Structure of the Page Heap Block

GFlags and PageHeap

Troubleshooting Memory Leaks With Just A Dump

Debugging Heaps and Heap Internals Part 1

Personally, I didn't know really where to start this blog post from at first, but I think it's best to first define the heap and it's purpose. The heap is used by the Memory Manager and the Heap Manager (for User-Mode processes). The heap generally speaking is a area of free memory in which processes can use for allocations for data objects and variables etc. The heap is not be confused with the heap data structure, even though there are data structures we can view to explore the heap.

In case, you didn't know, we have already discussed the Kernel-Mode version of the Heap greatly in my previous posts. Paged Pool and Non-Paged Pool are forms of Kernel-Mode Heaps. I will not continue with the discussion about Kernel-Mode Heaps, and therefore will instead continue with the discussion about User-Mode versions of the Heap.

If your a programmer or study computer science, then this topic should be easy for you to understand. This a good point to say, this is one of the reasons, why I suggest studying a language like C or C++.

Okay, getting back to the point, the heap is a potentially large area of free memory which our processes and programs can use for allocations. Unlike, allocations made on the stack, the allocations made on the heap have to explicitly unallocated, otherwise we will run into problems such as memory leaks. If your using a language like C#, and it's feature of Garbage Collection, then you will not need to worry or need to know about the internals of a heap, since it's managed for you by the run-time. Let's examine a simple program which allocates something onto the heap.


The program creates a pointer called some_pointer of a integer type, and then allocates some space on the heap to store a integer. The pointer would stored on the stack. Since, the heap can become exhausted, we have used a exception handler to handle any allocations which fail because of the heap exhaustion. The space allocated to hold the integer is then unallocated with the delete keyword.

By default, each process has a default heap created by the operating system, and is around 1MB in size, but can expand by using the /HEAP linker flag or by expanding automatically as needs require. Processes can also create private heaps for performance, using HeapCreate and HeapDestroy respectively. The process can then allocate memory blocks from the newly created private heap with HeapAlloc and HeapFree. A private heap is only accessible to the address space of the process which created it.

Using Windbg, we can view all the currently active heaps with the !heap extension.

We can gather further information by using the _HEAP data structure with the heap address. This is called the base heap.


This brings me to the point about the Heap Manager, and it's general structure. The Heap Manager consists of the core heap and the front-end heap, which is optional for User-Mode processes.


The Core Heap Layer provides general core functions, such as heap management (creation of heap blocks), segment management and blocks which belong to those segments and enforcing polices for the growth of the heap. On the other hand, the Front-End Heap Layer provides the functionality of the Low Fragmentation Heap (LFH).

Low Fragmentation Heap (LFH) and Heap Synchronization

The Heap Manager manages all the Heap allocations (Heap Blocks) into 128 different singly linked lists called Look-Aside Lists per a heap. Each list is created when the heap is created. This is also the reason why you see all the LIST_ENTRY data structures within the _HEAP data structure. When a process wishes to allocate a new variable onto the heap, and their isn't a already existing free block, then the Heap Manager will call into the Core Heap Layer and then a new heap block. This can lead to problems, which I will speak about in a moment. Before that, I we should take a look at Heap Synchronization among multiple threads.

With multiple-threaded programs, then threads can create multiple allocations and frees at the same time, leading to problems, since some operations may require the heap in remain in a consistent state. This is achieved with the use of a global heap lock, which protects the heap from access by other threads. The lock is achieved with the use of a Critical Section Object, and the call of the HeapLock function.


The lock is primarily used to execute the HeapWalk function, which enumerates all the heap blocks within a heap.


Now, back onto the discussion of the LFH, and how heap fragmentation can occur and lead to heap exhaustion. The available heap memory is broken into different sizes depending upon the size of the data type, and thus freed when needed. This will eventually lead to fragmentation of the heap, and heap allocations may fail even though there is enough heap memory to satisfy the request. Some of the free allocations won't used since they're too small, and therefore will remain as a potentially unusable space. 

To address, the problem, the Low Fragmentation Heap creates predetermined heap block sizes, and then places these block sizes into certain ranges called buckets. These buckets are managed by lookaside lists and and a tuning algorithm which automatically enables the LFH under certain conditions.  


Each bucket is used for different allocation sizes, with the first bucket being used for sizes between 1 and 8 bytes, and the second bucket used for allocation sizes between 8 and 16 bytes.


The LFH can't be used for heaps which have a fixed size, or heaps which were created with the _HEAP_NO_SERIALIZE flag.