The !podev, !poreqlist and !poaction aren't documented within WinDbg for some reason, but there is a person which has written about them thankfully. These extensions are a must for Stop 0x0A and debugging any issues related to power like Stop 0x9F.
!popolicy
The !popolicy displays information related to the current power policy of the current user.
!pocaps
The !pocaps extensions displays information in relation to the power capabilities of the system, this is ideal for checking if drivers are attempting to use a unsupported sleep state.
!poreqlist
The !poreqlist extension will list all outstanding power IRPs from any driver which has called the PoRequestPowerIrp function. The function will create a Power IRP and then send it to the top of the device stack for a given device object.
The list of power IRPs will be shown under the FieldOffset field. The extension will provide the device object, driver object and the nature of the power IRP.
!poaction
The !poaction extension will provide the current power action, and a list of devices which are currently being powered off or down. It also provides a list of completed IRPs. !poaction may require a Live Debugging session, but I'm not sure on this due to the lack of documentation.
!podev
The !podev will provide power related information for a PnP device object.
References:
Debugger Commands (!poaction, !poreqlist) that make my life easier (part 2)
You may have noticed or not have noticed with a few Stop 0x9F, the 0x4 value being the first parameter which indicates that a power IRP has failed to synchronize with the PnP Manager.
The PnP Manager is a subsystem of the I/O Manager, and is used to allow devices to be added or removed without little interaction from the user. The best example to illustrate this point, would the insertion or removal of USB flash drives or any USB connected. The user will not have to install any additional drivers to use the device or configure any settings. The USB flash drive will almost instantaneously be added to the file system, and be able to managed by the user. This is a result of the design of the PnP Manager and the code used within the driver.
The PnP Manager can't be directly interacted with any driver routines. The PnP Manager is both present in Kernel-Mode and User-Mode. The User-Mode version will interact with the Kernel-Mode version.
The PnP Manager is also responsible for maintaining the adding and removal of devices to the Device Tree. Each device within the Device Tree is called a Device Node, and consists of Device Objects which form a Device Stack. We can view the Device Tree in WinDbg with the !devnode extension and the DEVICE_NODE data structure.
You can then view each device node by dumping the Child and Sibling Device Nodes. The whole purpose of this post is not to explain the PnP Manager, but to explain what is the general problem or cause of a Stop 0x9F with subtype being 0x4. The crash is very similar to a Stop 0x9F with the subtype of a 0x3, however, instead of a pending IRP, the problem arises with a thread becoming hung during power transition.
Looking at the call stack, we can generally see that a timer has expired and a Watchdog has been notified of this expiration. A Timer is set with Stop 0x9F's to check the state of any threads or IRPs which are hung or need processing, if the counter is incremented above a certain threshold then the system notifies a Watchdog routine which bugchecks the system. I recommend reading my blog post the Internals of Stop 0x9F here. It explains the timer aspect and Watchdog counter threshold value.
Watchdogs
Let's examine concept of Watchdogs since they are a fundamental aspect for the error reporting with Stop 0x9Fs and therefore shouldn't be dismissed or mistaken for something which isn't important.
For each Device Object is there is a special timer which is used to avoid deadlocking the system, by giving the Device Object the opportunity to be able to cancel any pending I/O operations. The timer is associated with a IO_TIMER data structure. We can use the DEVICE_OBJECT data structure to find the IO_TIMER structure. The Timer field contains a 32-bit pointer to the mentioned structure.
We can then view the _IO_TIMER data structure, and examine it's fields.
The TimerList field is a doubly linked list of the timers found with the !timer extension. The TimerRoutine field is function pointer to the driver callback routine which will be called by the I/O Manager every second once the Timer has been started with IoStartTimer.
The DeviceObject field is the associated Device Object which is able to cancel any pending I/O operations. This pointer is usually found from the IO Stack Location of the current IRP.
The Context field indicates the driver context, and thus which driver functions the driver associated with the Device Object is able to call. I wasn't able to find any documentation of the TimerFlag field.
Synchronization PnP and Power IRPs
The PnP Manager is a subsystem of the larger I/O Manager, and as a result the I/O Manager is able to send PnP IRPs and Power IRPs. The Power Manager is a subsystem of the I/O Manager too. PnP IRPs need to synchronize against Power IRPs, in order to prevent two-state changing PnP IRPs from being present in the same stack at the same time, which allows you to safely call Power Transition or any Power Related IRPs for a particular PnP device. The synchronization is also required to ensure that IRPs aren't called out of order, since some PnP IRPs will need to be called within a certain power state.
Since I haven't been able to obtain a Kernel Memory Dump for this type of bugcheck, the best extensions and commands would be to use the following: !locks and !irpfind.
The Device Tree can be synchronized with IopDeviceTreeLock which is a type of Spinlock. Use the !locks extension to find any locks related to the Device Tree or I/O Manager, and then view the thread which is holding the lock, this should hopefully give you a insight into why a thread may stuck or a IRP isn't being processed. Use the !irp extension to view the IRP's stack.
Use the !irpfind extension to find any other related PnP IRPs and see if they are being processed.
References:
BSOD DRIVER_POWER_STATE_FAILURE (9f) when running WLK 1.5 CHAOS test
Which PnP IRPs are State Changing?
Which PnP and Power IRPs are synchronized against each other?
Usually, you may notice when using !irp in with a Stop 0x9F, that the completion status shows three different fields; sometimes with the addition of the pending flag being set. In this blog post, I'm going to explain what is actually happening and which completion status field is set.
As you can see, there is three different IO Completion Status fields present, so the question is, which one is WinDbg suggesting? These fields are defined depending upon what the driver was going to do with the completed IRP. They are used with the IoSetCompletionRoutine function, which is defined as follows:
These are all BOOL values, and thereby will be either true or false, depending upon the bit values. InvokeOnSuccess and InvokeOnError decided wherever the completion routine defined within the IO_STACK_LOCATION data structure will be called upon if the IRP is completed with a NTSTATUS Success value or NTSTATUS Error value.
The next important data structure is the IO_STACK_LOCATION data structure, which contains the completion routine and the control flags seen with the !irp extension. We need to use the 0xfffffa80116e07d0 address, since this is the address of the data structure for the current IRP stack location.
The flags field is used to check wherever the SL_PENDING_RETURNED flag has been set, and the IRP is pending.
The Control flags field is divided into two parts e and 0. Let's start with the numeric value first. There are three possible values: 0, 1 and 2.
0 = Nothing
1 = Pending
2 = Error
The second part corresponds to our Success, Error and Cancel fields as seen before. We need to convert e into numerical form, which is always 14. You then need to convert this 14 or 0xe into a binary format which is 1110. I used a free online binary converter to do this.
The 0 corresponding to the Pending field, and the other three values correspond to the BOOL values seen with the IoSetCompletionRoutine.
References:
I've explained how to debug a Stop 0x9F in previous blog posts, but here I'm going to explain how exactly it detects a timeout, and thus bugchecks with the Stop 0x9F.
We should understand now, that the two highlighted parameters are the most important for this type of bugcheck. The fourth parameter shows the Blocked IRP which caused the timeout, and the second parameter is the PDO of the device the driver is associated with.
Lets look at the blocked IRP, using the !irp extension.
So, we can see that a power related IRP is pending, and has held too long by a device object leading to the crash. tunnel.sys seems to be associated with the IRP, however, this isn't the exact problem here.
We can see that tunnel.sys calls GsDriverEntry, which is a routine called after the driver is loaded and initialized. It take two parameters: a pointer to the DRIVER_OBJECT data structure, and a pointer to the path in the registry where the driver is stored. It's called at IRQL Level 0.
The ndis.sys calls the the driver unload routine, which deallocates any pool and then unloads the driver. The ndis.sys driver then handles all the dispatch routines. ndis.sys is handled by a Microsoft Miniport driver, since IRP dispatching routines are mostly generic, and can be very difficult to code.
I'm not exactly sure what the ndis!ndisDummyIrpHandler does, but a dissembly shows a pointer to the WPP, which is used for software tracing.
It seems to mostly push some data stored in the registers onto the stack.
The device instance seems to point to Teredo, which is used for IPv6 connectivity for IPv4 Internet connected computers. I think we can establish there is something definitely network connected, and it's possibly related to the adapter of some sort.
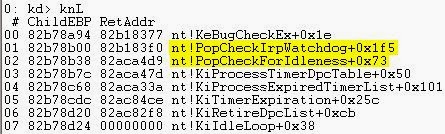
Now, let's get to the main point of discussion, the call stack which demonstrates how a time out is detected with a driver.
Looking at the stack, as we can see a timer has expired, which is shown with nt!KiProcessExpiredTimerList. We can view all the pending timers on a system with the !timer extension, for demonstration purposes, this was taken from a different dump file. The timer which would have been expired is the nt!PopCheckForIdleness.
So, when the timer expires, it calls the nt!PopCheckIrpWatchdog with nt!PopIrpList routine which searches through the IRP queue. Each time the nt!PopCheckIrpWatchdog is called, it increments a counter, when the counter has threshold has been exceeded, the system bugchecks with Stop 0x9F.
To find the driver which was causing the problem, I had to search the raw thread, it seems to be a very old network adapter driver. I believe it was related to Intel.
References:
Debugging Bug Check 0x9F: DRIVER_POWER_STATE_FAILURE
Hey everyone, I've got another Stop 0x9F example to show you, in this example I'm going to explain how to find the supported sleep states for a device and find the model of the hardware. I thought this would be especially helpful with the athrx.sys BSODs, since the looking up on the Driver Reference Table usually points to a generic entry.
Firstly, we'll use the !devstack extension on the second parameter of the bugcheck. The !devstack extension will display the device stack for a associated device object. Remember parameter two is the physical device object.
The > symbol points to the entry which matches the device object address used. I should also explain what a device stack is. A device stack is simply a list of device objects associated with a device node, each device object also has a associated a driver objects.
IRPs are usually processed by multiple device stacks. It's important to remember that a single driver object can have multiple device objects.
A device node is simply a physical device within the device tree.
Notice, the !devnode extension? (refer to screenshot). We can expand upon that information, by entering the !devnode extension again with the exact same address.
The Compatibility flags section shows the sleep states, and the Instance Path shows us how to locate the exact model of the hardware device.
Use the VEN_XXX and DEV_XXXX values in a PCI Database, and you should find the exact hardware device.
We're back with another Stop 0x9F to debug, in my opinion, these bugchecks are usually the easiest bugchecks to debug, since they usually point out the driver with the !irp extension, but sometimes the !irp extension may not reveal the true cause.
The two parameters we're interested in are, parameter 2 and parameter 4. The second parameter specifies the physical device which the associated problematic driver belongs to, and the fourth parameter specifies the IRP which seems to be blocking any further progress.
If we can examine the IRP, we can from the stack, that the driver which seems to be causing the problem is a Microsoft USB Hub driver, but from my experience, Microsoft driver are rarely the true cause for the crash.
So, let's debug deeper into the dump file (Minidump), and see which drivers are associated with the device. We can the !drvobj extension to view the associated drivers which control the device.
We can now see all the associated Dispatch routines for that device, and the drivers which issue these routines, we can at the bottom a third-party driver which is related to theVMware USB Monitor driver, which seems to be potentially outdated. The driver's associated dispatch routine is IRP_MJ_PNP, this major function code is used to request when PnP activity should occur.
I've previously explained how to debug a Stop 0x9F with a blocked IRP, although, there is a different situation when the !irp, !devobj and !devstack extensions are not viable option for debugging. This is because the cause of the crash is slightly different.
From the parameters provided by the bugcheck, we get a general idea of the problem, and what happened, basically a thread was holding a lock, which wasn't released, causing the synchronization to time out.
From my understanding, the lock was never released by the thread, since it's wait wasn't satisfied, it wasn't able to obtain the objects it was waiting for.
We can view which objects the locked thread was waiting for, with the !thread extension and parameter 3.
We can see that the thread is waiting for three Event objects, which are all Notification Events,
the thread is waiting for the completion of a certain event of procedure, once this has become complete, the Event objects will switch from Non-Signaled to Signaled, and will release the thread(s) from it's waiting state. Once a thread has left it's wait state, then it can resume it's normal operations.
From the call stack, there is further evidence to support that thread holding the lock is waiting for multiple Event objects: nt!KiCommitThreadWait and nt!KeWaitForMultipleObjects.
Events can be exposed to Device drivers, so let's check which drivers may be causing the thread to wait. I dumped the raw stack of the current thread we were viewing, and found a very outdated ATI graphics card driver.
Two useful data structures you could use in a situation like this are: nt!_DISPATCHER_HEADER and nt!_KOBJECTS. The type field of the Dispatcher data structure will correspond to the a value within the Objects data structure, which in turn will indicate the type of object the thread is waiting for.
References:
http://msdn.microsoft.com/en-us/library/windows/hardware/ff553202%28v=vs.85%29.aspx